Summative Assessment: Food Access and Food Deserts
Food Access and "Food Deserts" in the United States and in Your Capstone Regions
The Food Access Research Atlas has been created as an online mapping tool by the Economic Research Service of the U.S. Department of Agriculture. It is available at USDA Economic Research Center: The Food Access Research Atlas. The atlas has been designed to present a spatial overview of food access indicators for low-income and other census tracts using different measures of supermarket accessibility. We are focusing on food access because the ability to access a full complement of foods at reasonable prices via supermarkets and other more diverse food sales outlets is one of the main impediments to improved diet among poor households in the United States. The atlas presents an online, zoomable map that you can use to understand food access in different districts of the United States (divided by census tracts). Local and regional data can also be downloaded. When it is time to consider food access in capstone regions in Peru (capstone regions outside the United States) we will present some alternative resources below.
Instructions
First, go to Food Access Research Atlas for the description of the food atlas, including the definition of a "food desert".
Please read these first few short sections in this description regarding the food atlas and pay attention to how a food desert is defined:
- Measures of food access
- Additional indicators of food access
- Data availability and updates
- Component layers for mapping tool
Now download the worksheet for the summative assessment where you will see the questions for the assessment. These are also reproduced below to more easily understand the process of the assessment.
Go to the Food Access Research Atlas. Read the brief overview points on the page and then click on "Enter the Map". Then work to answer the questions on the worksheet. The questions are shown here but the spaces to answer are given on the worksheet.
- What is the definition of a food desert that is used by the map (the original definition, before changes made more recently)? That is, what does the phrase “LI and LA at 1 and 10” mean? Answer in question one on the worksheet.
- Before zooming in on the atlas (link above), make sure you have the background set to ‘topo’ (not satellite imagery), and the food desert criteria set to “LI and LA at 1 and 10 (original food desert measure)” – these should be the default settings. Now, look at the food desert map of the whole U.S. Name three regions (which can include parts or all of the multiple states) that seem to have a disproportionately high incidence of food deserts. Answer in question two on the worksheet.
- Zoom in on the Philadelphia, PA metropolitan area (if needed you can use the "find a place" search box). Roughly centering Philadelphia in the view and with Woodbury Heights, NJ in the south and Elkin Park, Pa in the north—it’s ok that some areas are in New Jersey since we are thinking about a metro area and not just Philadelphia proper (see guide image below). Estimate the percentage of neighborhoods in this area with food deserts and write it on the worksheet in worksheet question three.
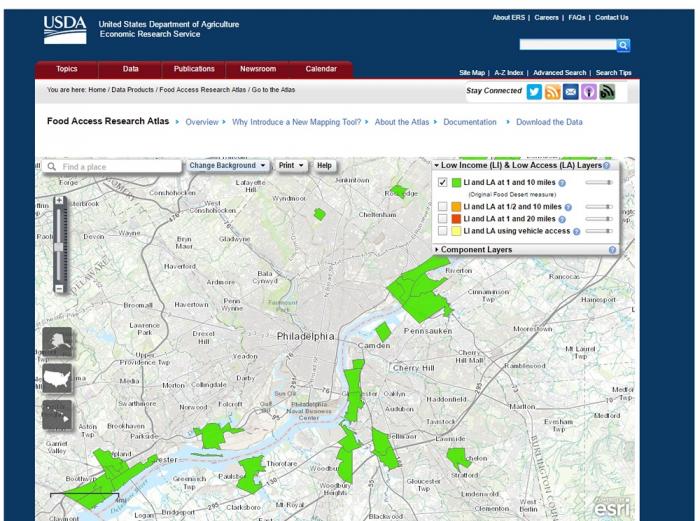 Figure 3.2.4. Map of food desert areas in Philadelphia, Pennsylvania. Note that the green layer (original food desert definition) is checked.Credit: Food Access Research Atlas
 - Now zoom in on the Houston, Texas area in the mapping tool. (hint: it's on the gulf coast, west of New Orleans). Place the view with Houston centered and Spring in the North and Friendswood in the South. Consider the Houston city area at about this diameter (Spring to Friendswood) and estimate the proportion of neighborhoods with food desert status and limited food access and note it in question four on the worksheet. You should also use the slider next to the green checkbox to increase the transparency of the green layer, and then expand the section on "component layers" under the different check boxes, so that you can turn on, one by one, the layers for low access at 1 and 10 miles, and low income. Notice that each of these conditions (LI and LA at 1 and 10) is far more widespread than the green food desert layer, and it is the combination of the two that are needed to create the worst level of food access.
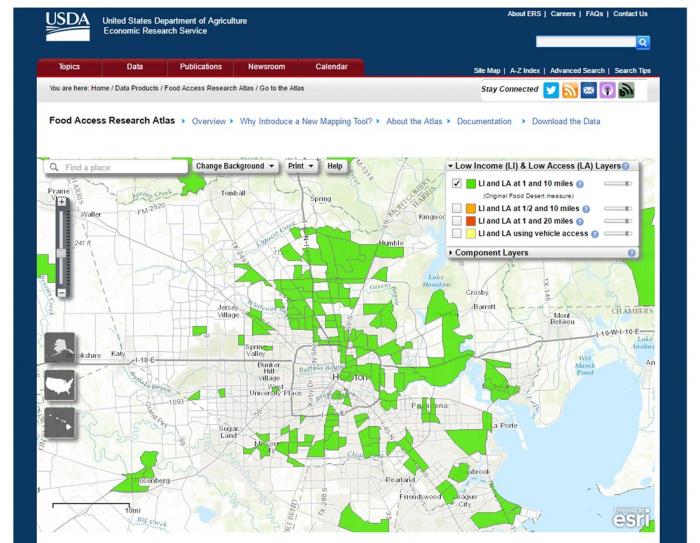 Figure 3.2.5. Map of food desert areas in Houston, Texas, for use in checking the view in the summative assessment.Credit: Food Access Research Atlas
 - Which city has a higher percentage of food deserts? Can you think of some reasons why this would be the case? Answer in question five on the worksheet.
- Now read the short excerpt from pp. 104-106 in Re-storing America's food deserts, chapter 8 in Winne, M. (2008). Closing the food gap: Resetting the table in the land of plenty, about efforts to “re-store” food deserts in Philadelphia.[1]1 Note this book chapter is an excellent source for information and case studies of other efforts to fight food deserts, and some reflections about what works and doesn’t work in improving food access in the United States. Return to this assessment page to answer the rest of the questions.
- Now pretend you are on a food access advisory panel that is supposed to help develop a policy to improve food deserts in Houston. You are supposed to organize your advice in three to four main points on the problem and some steps to solve it. Your first point can be what you found from the food access atlas above, pretending that you are writing to an audience that knows little about the problem and its effects on diet and nutrition. Then suggest some solutions, based on the example of Philadelphia and the Paul Winne reading. Use the worksheet, question six.
- Listen to the first ten minutes of the following 21-minute radio clip below (this will be played for the whole class if in the hybrid class). Look for additional solution ideas for food deserts in the interview since you will be asked about new strategies additional to those from Philadelphia. Houston Matters Radio Program: Food Deserts in Houston
- Did you learn anything more from this radio interview? Note additional strategies and ideas that came from the interview, in question seven on the worksheet.
- Now consider your focus region for the capstone project:
-
For U.S.-based capstone regions: Look at this region in the food access atlas mapping tool, and make notes about whether there are food deserts (e.g. the rough percentage, as above), whether these are in urban or rural areas, and ideas about why these deserts might exist.
- For other global capstone regions (e.g. Peru): read the World Food Program, briefly describe two or three factors influencing limiting food access in the smallholder systems of your region. How do challenges to food access differ between the United States and these systems where local on-farm production is so important?
- For Northern Thailand: Go to the FAO's Food Security and Nutrition Status in Thailand 2005-2011. Read the forward and introduction and then take a look at Chapter Three. Briefly describe two or three factors influencing food access or food security in the systems of this region. How do challenges to food access differ between the United States and these systems?
-
For other regions not listed or adequately addressed on the WFP site: find one resource that speaks to food access in your region and describe their findings and how you think they come to these conclusions via a methodology.
-
- If you do a google or other web search, can you find examples of efforts to address food deserts or improve food access in your capstone region? Name one and describe it in a few sentences in question 9.
[1] Chapter 6, Re-Storing America’s Food Deserts in Winne, M. (2008). Closing the food gap: Resetting the table in the land of plenty. Beacon Press.
Submitting Your Assignment
Please submit your assignment in Module 3 Summative Assessment in Canvas.
Grading Information and Rubric
Your assignment will be evaluated based on the following rubric. The maximum grade for the assignment is 36 points.
| Criteria | Possible points awarded |
|---|---|
| Short answer questions one through five, correct use of mapper and interpretation of the map | 10 points |
| Assessment of Houston food desert situation and sufficiently detailed suggestions drawn from reading | 10 points |
| Additional learning and new strategies are drawn from Radio Clip "Houston Matters" | 5 points |
| Description of food access in or near the capstone region | 3 points |
| Description of efforts to improve food access in capstone region | 3 points |
| Overall writing style, grammar, spelling | 5 points |