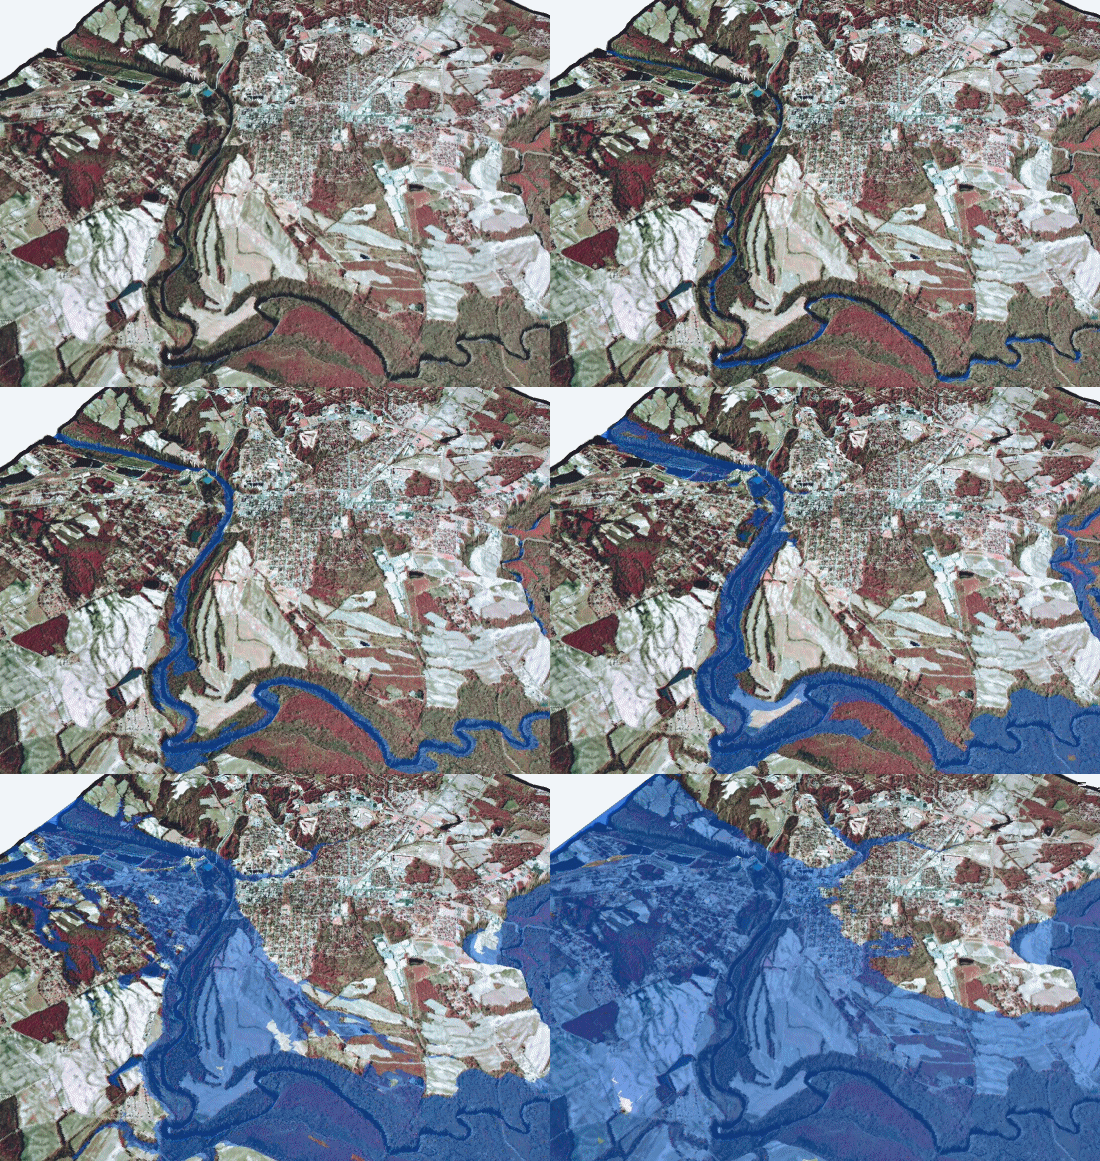
True flood modeling, such as that used to produce FEMA's Digital Flood Insurance Rate Maps (DFIRMs), is a complex process that includes terrain data, rainfall runoff or coastal storm surge models, hydrologic modeling, and hydraulic analysis. To determine the potential depth of flooding, one must be able to predict how much water is in the watershed at any given time, how that amount of water changes over time during a storm event, and how the flow of water is impeded or obstructed by vegetation or man-made structures. Floodplain mapping comprises an entire engineering discipline in its own right, and while GIS tools are extensively employed, simple topographic analysis alone does not create an accurate flood map.
That said, there may be legitimate applications for a more simple inundation analysis, such as you will perform in this lesson's lab activity. One real-world example of this was the inundation of New Orleans during Hurricane Katrina. Once the levees broke, and the water began to inundate low-lying areas of the Ninth Ward, the floodwaters were contained by the terrain features (natural and man-made) and simply rose until a steady-state condition was reached. In the end, the floodwaters were truly and accurately represented by a flat surface, and the depth of flooding could be simply determined by subtracting the land elevation at a given location from the elevation of this flat water surface. You will perform this simple type of flood inundation analysis on a land surface created from lidar point data. It will be up to you to evaluate how realistic the results are, and how they should or should not be used to predict real-world events.

Read More
You can read about modeling of the New Orleans flood in these articles:
- Gesch, Dean. Topography-based Analysis of Hurricane Katrina Inundation of New Orleans. US Geological Survey.
- Griesmer et al., May 2006. Hurricane Katrina and Disaster Recovery Geospatial Process for Damage Assessment. Proceedings of the 2006 American Water Resources Association Specialty Conference: GIS and Water Resources IV.