The image enhancements that use the computer display to alter the appearance of an image are impermanent; they are usually saved only in the software project document. It is also possible to use mathematical and statistical methods to exploit relationships between spectral bands to create new archivable raster data products that can be also be interpreted. The Normalized Vegetation Difference Index (NDVI) is an example of such a product that is commonly used to support analysis of vegetation.
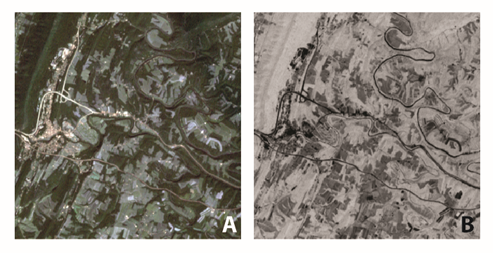
The calculation of NDVI is very straightforward. It is the ratio of the subtraction of the near-infrared and red bands to their sum [(NIR-RED)/(NIR+RED)], and its value ranges from -1 to 1, where green vegetation typically ranges between 0.2 and 0.9. In Figure 2, the NDVI image is useful for identifying agricultural fields that are in different phases of growth. Fallow fields here are dark, having low NDVI values, while green vegetation, such as the forests on the ridgeline, are much brighter. The NDVI image emphasizes the location of water bodies and impervious surfaces (black), but does a poor job of differentiating between the two based on value alone. Instead, the visual interpretation element of shape can be used to differentiate here the meandering river and the relatively straight roadway.
More sophisticated methods of analyzing spectral data also exist. The Tasseled-Cap Transformation is a statistical method for reducing multispectral data. First designed to support agricultural analysis (Kauth and Thomas 1976), it has also been shown to be useful in land cover change mapping (Healey et al. 2005). Like NDVI described above, this transformation takes advantage of the differences in NIR and RED reflectance.
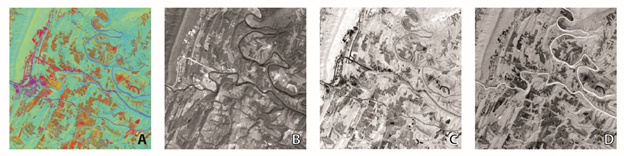
The Tasseled-Cap Transformation decomposes a multispectral image into three main components that comprise 97% of the Landsat spectral data content; these components are brightness, greenness, and wetness. Each is said to be related to particular physical feature types:
- Brightness, Figure 2B, is assigned to the Red color display channel is associated with impervious surfaces such as asphalt.
- Greenness, Figure 2C, is assigned to the Green color display, is associated with vegetation.
- Wetness, Figure 2D, is assigned to the Blue color display, is associated with moisture.
Each of the three components can be visualized separately; however, when combined, these three components can provide great insights into the landscape as shown in Figure 2A. This Tasseled-Cap Color image highlights differences between features that are not found by looking at the NDVI image. For example, it is possible to identify a road feature by its thin linear shape and low reflectance values in the NDVI image. Looking at that same feature, Tasseled-Cap Color image, reveals more subtle differences. Look at the small built-up area in the left of the images. In the NDVI image, this feature looks to be one feature, however, looking at the Tasseled-Cap image we can see that what seemed to be a single feature really is many smaller features.
You have now looked at several methods for enhancing the spectral data from remotely sensed images. In order to maximize the usefulness of such transformations, an analyst must choose the enhancement most appropriate to the task at hand. Spectral enhancements alone are not enough on their own to make interpretation accurate; a good command of the various interpretation elements, combined with strong contextual knowledge of the image under analysis, contributes to successful interpretation.
Healey, S. P., W. B. Cohen, Y. Zhiqiang & O. N. Krankina (2005) Comparison of Tasseled Cap-based Landsat data structures for use in forest disturbance detection. Remote Sensing of Environment, 97, 301-310.
Kauth, R. J. & G. Thomas. 1976. The tasseled cap--a graphic description of the spectral-temporal development of agricultural crops as seen by Landsat. In LARS Symposia, 159.