For decades, most digital geographic information was confined for use on desktop-based personal computers (PCs) or in-house mainframes and could not be easily shared with other organizations. GIS analysts would access data from their own workplace computers that were often connected to a central file server somewhere in the office. Specialized software was required to view or manipulate the data, effectively narrowing the audience that could benefit from the data.
With mass uptake of the Internet in the mid-1990s, people began thinking about how maps and other geographic information could be shared across computers, both within the organization and with the general public. The first step was to post static images of maps on HTML pages; however, people soon realized the potential for interactive maps. The first of these, served out by newborn versions of software such as Map Server and Esri ArcIMS, were horrendously pixelated, slow, and clunky by today's standards. Limited by these tools, cartographers had not yet arrived en masse on the web mapping scene, and most of the maps looked hideous. However, these early interactive web maps were revolutionary at the time. The idea that you could use your humble web browser to request a map anywhere you wanted and see the resulting image was liberating and exciting. See Brandon Plewe's 1997 book GIS Online (findable in many university geography libraries) to get a feel for the web mapping landscape at this time period.
These early, dynamically drawn web maps ran into challenges with speed and scalability (the ability to handle many simultaneous users). The server could only accommodate a limited number of map requests at a time before slowing down (at best) and crashing (at worst). Web maps matured significantly in these two metrics when websites began to serve out tiled map images from pregenerated caches. Why ask the server to draw every single map dynamically when you could just put forward an initial investment to predraw all possible map extents at a reasonable set of scales? Once you had the map images drawn and cached, you could serve out the images as a tiled mosaic. Each tiled map request was satisfied exponentially faster than it would take to serve the map dynamically, allowing for a server to accommodate hundreds of simultaneous users.
Following the lead of Google Maps, many sites began serving out “pre-cooked” tiled map images using a creative technique known as Asynchronous JavaScript and XML (AJAX) that eliminated the ubiquitous and annoying blink that occurred after any navigation action in earlier web maps. Now you could pan the map forever without your server gasping for breath as it tried to catch up.
Cartographers, who had largely been resigned to trading aesthetics for speed in web maps, also realized the potential of the tiling techniques. No longer would the number of layers in a map slow down the server: once you had pregenerated the tiles, you could serve a beautiful map just as fast as an ugly one. Web maps became an opportunity to exercise cartographic techniques and make the most attractive map possible. Thus were born the beautiful, fast, and detailed “web 2.0” basemaps that are common today on Google, Microsoft Bing, OpenStreetMap, and other popular websites.
As web browsers increased in their ability to draw graphics using technologies such as SVG and later WebGL, the possibilities for interactivity arose. On-the-fly feature highlighting and HTML-enriched popup windows became common elements. For several years, developers experimented with plug-ins such as Adobe Flash and Microsoft Silverlight for smooth animation of map navigation and associated widgets. More recently, developers are abandoning these platforms in favor of new HTML5 standards recognized by the latest web browsers without the need for plug-ins.
Although maps had arrived on the browser by the mid-2000s, they were still largely accessed through desktop PCs. The widespread adoption of smartphones and tablets in subsequent years only increased the demand for web maps. Mobile devices could not natively hold large collections of GIS data, nor could they install advanced GIS software; they relied on web or cellular connections to get maps on demand. These connections were either initiated by browsers on the device, such as Safari, or native applications installed on the device and built for simple, focused purposes. In both cases, GIS data and maps needed to be pulled from the organization's traditional data silos and made available on the web.
The importance of web services
All the above web mapping scenarios are possible because of web services. If you search the Internet, you'll find many definitions of web services and can easily get yourself confused. For the purposes of this course, just think of a web service as a focused task that a specialized computer (the server) knows how to do and allows other computers to invoke. You work with the web service like this:
- You invoke the web service by making a request from an application (the client). To make this request, you usually use HTTP, a standard protocol that web browsers use for communicating between clients and servers. The request contains structured pieces of information called parameters. These give specific instructions about how the task should be executed.
- The server reads the request and runs its web service code, considering all the parameters while doing so. This produces a response, which is usually a string of information or an image.
- The server sends you the response, and your application uses it.
Examine how the following simple diagram describes this process, returning a map of current precipitation:
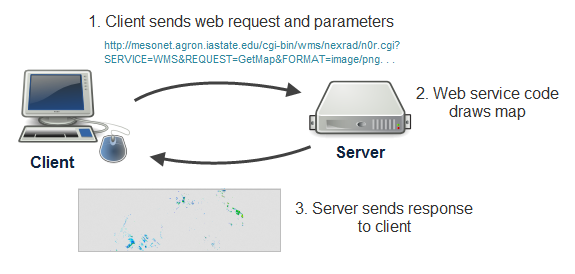
Now, for an example. Let's suppose that you've identified the URL of a web service out there somewhere that draws maps. You make a request by constructing a URL (http://...) containing the address of the web service and various parameters for the map, such as the format of the image you want to receive (JPG, PNG, etc.), bounding box (coordinates defining the geographic area you want to see mapped), and map scale. You paste this into your browser's address bar and the server sends you a response containing the map image you requested.
Here's an example of just such a request, using a radar map of the United States. First, see if you can identify some of the parameters in the URL. Then take a guess at what the response will look like when you get it back. Then click the link to invoke the web service and get the response:
As you examined the URL of this request, you might have noticed parameters indicating the width and height of the image, the image format, the image background transparency, and the bounding coordinates of the map to be drawn. These parameters provide specific details about how the web service should run its map drawing code. You see these parameters reflected in the response image sent back to your browser when you clicked the link. In a future lesson, you'll learn about more of the parameters in the request above.
Not all web requests invoke web service code. Some web requests just return you a file. This is how tiled maps work, and this is why they are so fast. You'll learn more about tiled maps in a later lesson, but examine the following request for a specific zoom level, row, and column of a tile:
http://a.tile.openstreetmap.org/15/11068/19742.png
The request drills down into the server's folder structure and returns you the requested PNG image as a response. No special code ran on the server other than the basic file retrieval, therefore you could argue that a web service was not invoked. However, this type of simple web request is also an important part of many web maps.
At this point, you might be thinking, “I've used web maps for years and I have never had to cobble together long clunky URLs like this. Have I been using web services and other web requests?” Absolutely, yes. As you navigate Google Maps, your company's online map site, and so on, your browser is sending hundreds of web requests similar to this one. You've just never needed to know the details until now. When you begin setting up your own GIS server or designing your own client web application, it becomes important to understand the theory and architecture behind web traffic.
Not all web services use the same format of URL and parameters. In this course, you'll learn about some of the most common formats for online web services, especially ones that have been openly developed and documented to work across software packages.
Viewing web service requests in real time
Here's a simple way you can view web requests made “behind the scenes” by your browser as you navigate a website. These instructions are for the tools provided by Mozilla Firefox. Chrome and other browsers have similar tools that typically go under the name "developer tools" or "web tools" and should not be difficult to locate.
- Open Mozilla Firefox (if it's not already running) and from the main menu choose More Tools -> Web Developer Tools. This will open the developer tools window in the bottom part of your browser. At the top of the window, you can see different tabs "Inspector", "Console", and so on. Select the one called "Network", which is for monitoring network traffic. In addition to the "Network", the "Console" tab will be important for this course because it will show the Javascript and other error messages if something is not right with your Javascript code.
- Make sure that All is highlighted in the menu of filters below the tabs (which will contain items such as All, HTML, CSS, JavaScript, etc.).
- Hit this website for the Portland TriMet interactive system map (note that this site exclusively uses FOSS mapping software).
- Navigate the map of the Portland transportation system.
- Notice the web requests as they are sent. You'll see a lot of requests appearing for map tiles.
- Hover over a request to see its full URL. If the response is an image, hovering over the little thumbnail in front of the URL will show a larger version of the returned image.
- When an entry in the list of requests is selected, the right part of the window will show many additional technical info about the request and response.
This kind of developer tool will be valuable to you later in the course as you develop your own web maps, mainly for troubleshooting scenarios where you expect a map to show up and your browser does not send you the expected response.
References
Plewe, B. (1997). GIS online: Information retrieval, mapping, and the Internet. OnWord Press.