In this walkthrough, you will use QGIS to create a general-use basemap of Philadelphia. The idea is that you will be able to overlay thematic layers on top of this map in lessons to come. The data for this walkthrough is the base data for Philadelphia that you preprocessed in Lesson 3. If you followed all instructions, you should have this data in a folder called c:\data\Philadelphia or something similar. It should be using the mercator projection EPSG:3857.
Designing the map using QGIS
- Open QGIS, start a new project, and add the city limits shapefile. The projection of the project shown at the bottom right should automatically change to EPSG:3857.
- Open the Layer Styling panel, and change the symbol layer type from Simple Fill, to Outline: Simple Line.
- Change the Stroke width to 3 Points.
- Click on the current apllied color, and change the HTML notation (the hex code of a color) to #88789e.
- Hit Apply and close the Layer Styling Panel.
- Add the waterways shapefile to the project.
- Following the same process as above, change the color of the default SImple Line symbology to #89aceb.
- Change the width to 1 Point.
- Hit Apply and close the Layer Styling Panel.
- Add the natural features shapefile to the project and change the order of layers such that waterways is above natural features.
- Open the Layer Styling panel for natural features, and change the type from Single Symbol to Categorized.
- Use the drop down box below to assign the category value as type.
- Click the Classify button below to see all the available values of type.
- Change the colors for parks and forests to #ae8, and for reverbanks and water to #89aceb. After hitting apply, your map should look similar to this:
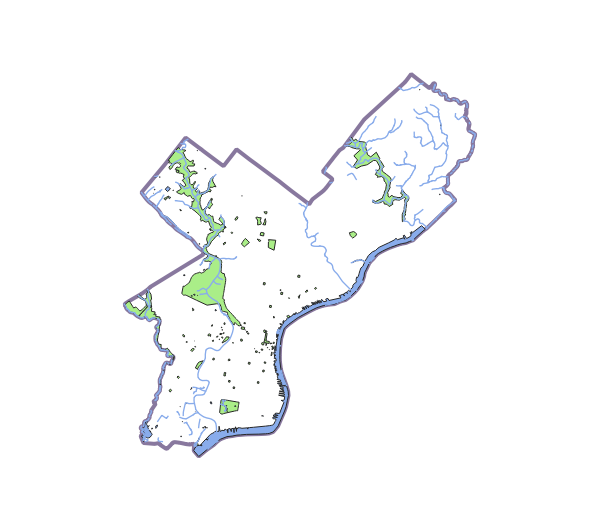 Figure 5.8 Progress so far.
 - Add the Neighborhoods shapefile to the project.
- Open the Layer Styling panel.
- Click on Simple Fill, and change both FIll color and Stroke color to tansparent. You can also turn the opacity all the way down to 0% to achieve the same result. This is because all we want from this layer are labels with the names of the neighborhoods.
- Hit Apply, and select the labels tab
 .
. - Change the No Labels option to Single Labels.
- Verify that the Value is set to NAME.
- On the first tab below called Text, change the font to Arial Black, size 12, color: #88789e.
- Select the furthest to the right tab called Rendering
 .
. - Enable the Scale Dependent Visibility, and set the minimum scale (the one with the minus on the magnifying glass) to 1:100,000.
- Hit Apply and close the Layer Styling panel. The result should look similar to the image below and the labels should disappear when you zoom out.
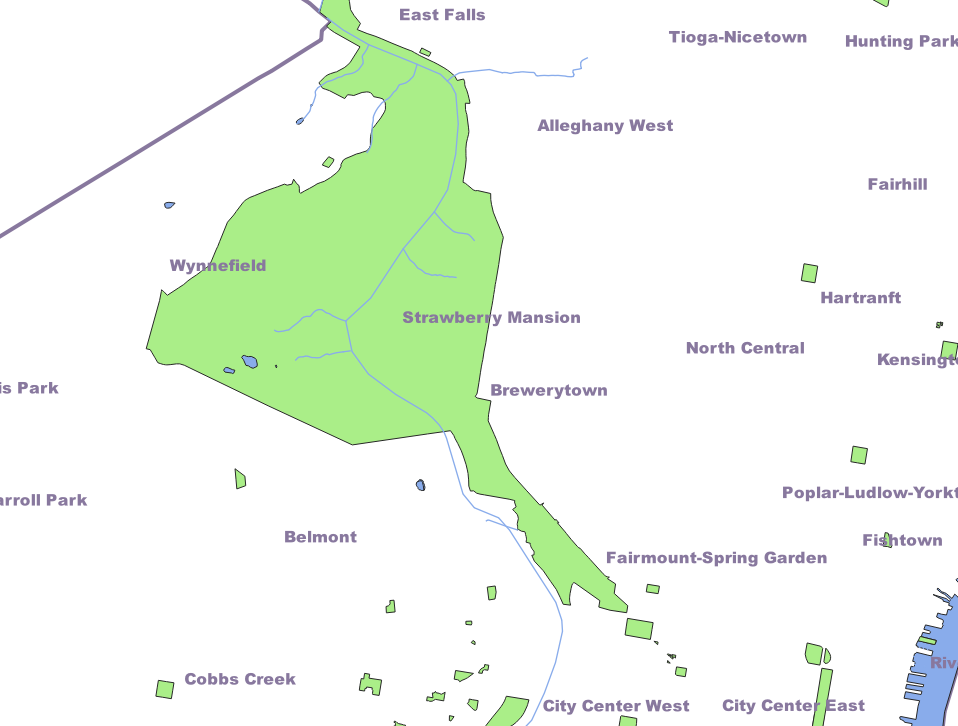 Figure 5.9. Neighborhood labels.
 - Add the roads shapefile to the project and rename it to Major Roads. The idea here is that we want minor roads to only show up at higher zoom levels. We will achieve this by setting up this new layer, to only show major roads and then later in step 30, add the roads layer to the project a second time to show all roads but with scale-specific rendering rules.
- Open the Layer Styling panel, and change the symbology to Categorized.
- Change the value to Type, and click Classify.
- Unselect all types but the following and set the color and width attributes as listed:
- motorway. Color: #606060, width: 3 Points.
- trunk. Color: #606060, width: 3 Points.
- primary. Color: #838383, width 2 Points.
- Click Apply and close the panel.
- Add the roads shapefile again and move it to a position directly below the Major roads layer in the Layers list so that major roads will be rendered on top.
- Open the Layer Styling panel.
- Set the color to #b6b6b6 and the width to 1 Point.
- Click on the labels tab, select Single Labels, and make sure that value is set to name.
- Change the font to Arial, size 11.
- Change the color to #b6b6b6.
- Go to the rendering tab, and enable the scale visibility.
- Set the minimum visibility to 1:25,000.
- Click apply and close the panel.
- The scale visibility in step 37 only applies to the labels, so we need to make the roads themselves only show up at a certain scale: Right click on the name of the layer, and select Set Layer Scale Visibility.
- Set the minimum visibility to 1:100,000. After clicking Ok, try out how the features and labels shown in the map change while you zoom in and out. Notice how minor roads only show up at higher zoom levels, and road labels are only starting to appear at even higher levels. The two images below give you an idea of how things should look like at low and high zoom levels.
One thing to note is that QGIS, in addition to applying the minimum scale condition for the labels, also by default applies a label layouting algorithm that will suppress labels of features that are very small at the current zoom level or would lead to overlap between labels. As a result, you will see even more road labels show up when you zoom in further. The technique of adding the same layer multiple times but with different settings is very helpful for implementing scale-specific rendering rules in the context of creating basemap tiles and in other application domains as well. We could have easily created a visual hierarchy with many more levels of features and labels showing up at different zoom levels but wanted to keep things relatively simple in this walkthrough. We also did not make much use of the more advanced approaches that QGIS provides for symbolizing vector layers, some of which you saw in the Lesson 1 walkthrough.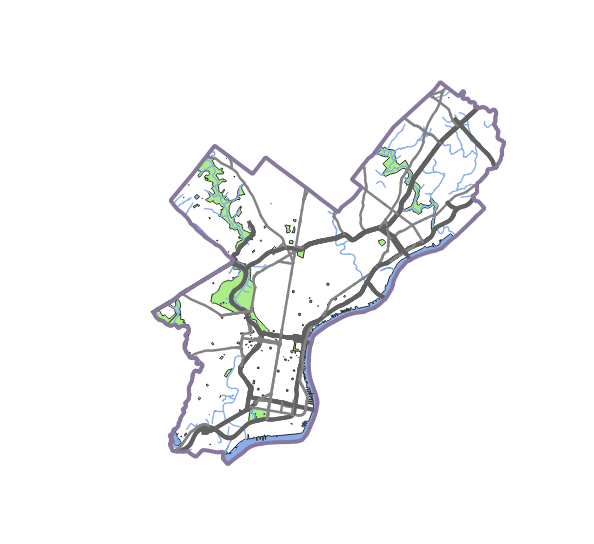 Figure 5.10 Map so far zoomed out.
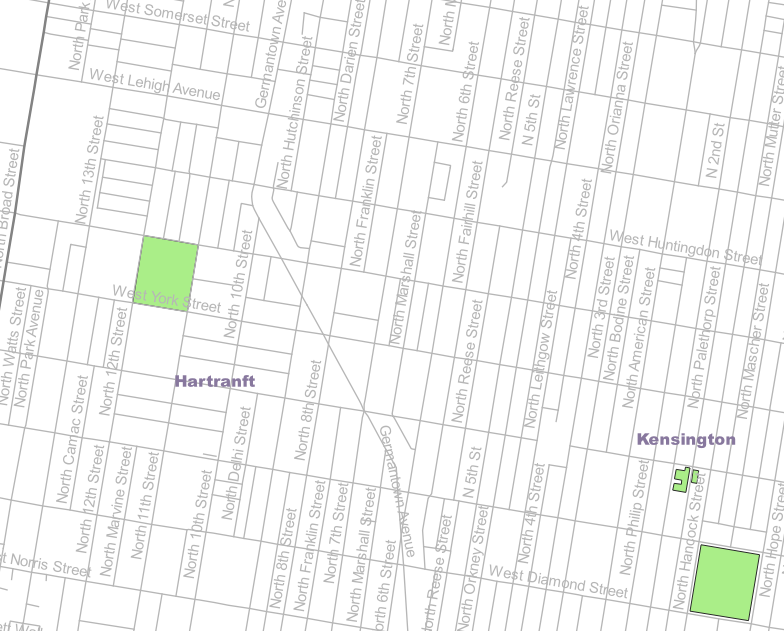 Figure 5.11 Map so far zoomed in.
 - Lastly, add the Railways shapefile to the project.
- Open the Layer Styling Panel.
- Change the color to #d2bcb0, and set the width to 1 Point.
- Before moving on, make sure the layers are arranged in the following order:
- Neighborhood
- City Limits
- Major Roads
- Roads
- Railways
- Waterways
- Natural
It would also be a good idea to save the project now!
Exporting the tiles
Once you've finished the map design phase and your map looks good at each scale, you can start thinking about generating the tiles. For large maps, plan for this to take some time, taking into account some of the factors discussed earlier in the lesson, such as the shape of the map and the scale levels you choose to generate.
This section of the walkthrough explains how to generate tiles of your Philadelphia basemap, and host them on the web. You will then test them out in a web page.
- Click the Toolbox icon on the top ribbon
 .
. - Search for xyz in the Processing Toolbox window that opens up.
- Select the tool named Generate XYZ tiles (Directory).
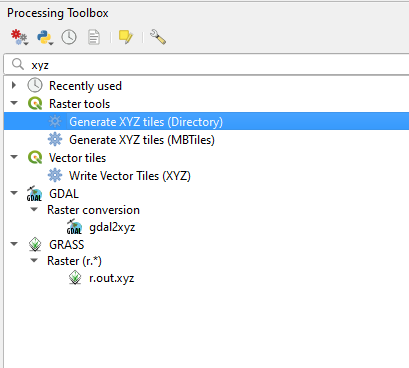 Figure 5.12 Generate tiles tool.
 - In the new window that opens, select the following options:
- Extent: click the button next to the box and select Calculate from Layer and select the City Limits layer (This determines the area for which tiles will be created. Some of the other options here can also be very useful, e.g., in cases where you don't have a suitable layer for deriving the extent from.)
- Minimum zoom: 0 (this is the lowest zoom level for which tiles will be created).
- Maximum zoom: 17 (highest zoom level for which tiles will be created).
- Tile format: PNG.
- Scroll down and select your desired Output directory by picking the Save to Directory... option and selecting a new folder that you created for storing the tiles called PhillyBasemap.
We are setting the minimum zoom level to zero here, so that tiles will be provided all the way up to the top of the pyramid in the tiles hierarchy. However, often when working with a relatively small project area like this (e.g., in your term projects), your plan is to limit how far out the user can zoom to avoid that the displayed area becomes tiny or (almost) invisible. In that case, it makes sense to set the minimum zoom option accordingly and use Javascript programming (see next few lessons) to restrict the possible zoom levels. That said, in terms of storage space, you won't save much by excluding the lower zoom levels because almost all storage will always be taken up by the highest levels.
- Press Run to create the tile images. Once this is done, check out the content of the output folder.
Hosting and testing the tiles
Setting up S3 storage and uploading tiles
If you navigate around your folder of tiles, you'll notice that the images are extracted into a highly organized structure of level\column\row. This structure is understood by various mapping programs and APIs, so all you have to do at this point is put your tiles onto a web-facing server. If you already have acces to some web space, you could simply upload the folder with the tiles to that web server. What we will instead do in this course is use Amazon's cloud services, namely the S3 service for scalable storage, as a convenient place to host the tiles on the web. We will place the tiles there and then test them in a web map. However, this will require you to set up an Amazon AWS account first, including registering a credit card. Uploading and accessing the tiles over the web will then cause some costs that your credit card will be billed for at the end of each month but these will be very small, < $10 most likely, if you just use the tiles for this class and follow the instructions below. The steps below will include descriptions of how to monitor the costs and how to set up a billing warning if the accumulated monthly costs go above a certain level. Please note that the workflow below is very specific to S3. If we would instead use a normal web server to host the tiles, we would most likely use FTP or SCP to upload the tiles to some folder in our personal web space on that server.
-
Create a Root user account using your PSU email. (If you already have created an AWS account for your PSU email, e.g. for another class, you can instead log into that account and continue with Step 3.)
You can give your account any name you want. You will then have to verify your email address and define a Root user password. After that, you have to enter your contact information and confirm your identify by entering a verification code sent to you via SMS or an automatic call to the phone number you provide. Lastly, you have to select a support plan; please choose the free "Basic support plan". When done setting up your account, you can click the button that leads to the "AWS Management Console". -
Now, in the AWS Management Console, go to the search bar at the top of the screen and search for Billing . Click on the link (the name of the service at the top) to get to the "AWS Billing Dashboard".
 Figure 5.13 Amazon services search bar
 -
The Billing Dashboard will show you both a cost estimate for where you will end up at the end of the month and the current costs accumulated so far this month ("Current MTD balance"). Further down below, there is a link called "View your bill" which will lead you to a page where you can explore the costs accumulated so far by unfolding the items at the bottom under "Amazon Web Services EMEA SARL charge by service".
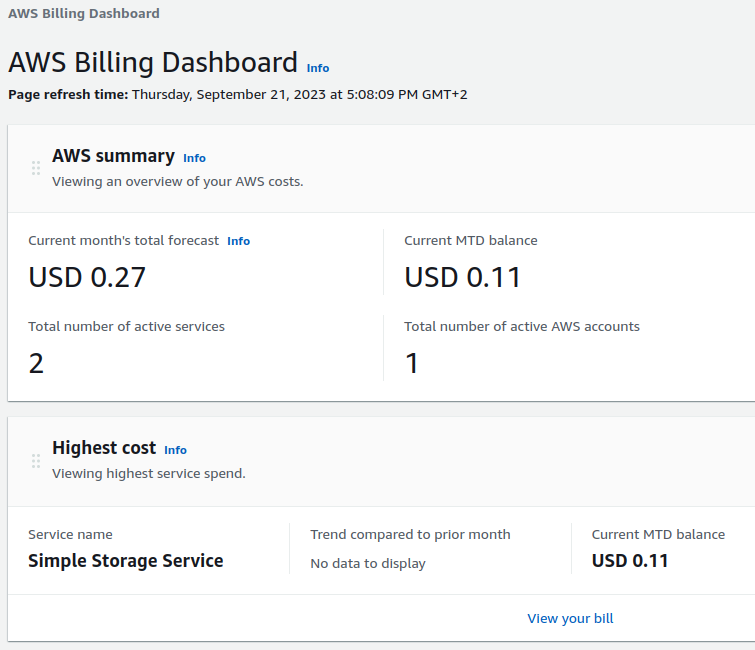 Figure 5.14 Amazon services billing information
 -
Now type in the term Budget in the search bar at the top and select the sevice called "AWS Budgets" by clicking the name. We now want to set up a budget so that you will get alerted by email if the estimated or accumulated costs for a month pass a certain threshold.
-
Click on the orange button "Create a budget" at the top. On the following page, select the options "Use a template (simplified)" and "Monthly cost budget", then fill out the details for the budget as shown in the image below but using your own email address to which the warning should be sent. The $5 is just a suggestion. Feel free to use a somewhat higher or lower number. You can also change the name of the budget but the default name is fine. Lastly, click the orange "Create budget" at the bottom.
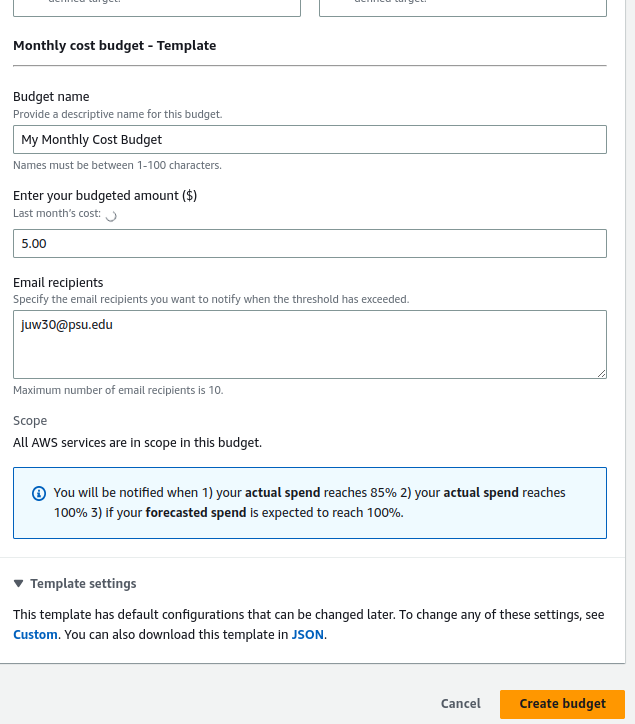 Figure 5.15 AWS creating the budget
As the information text said, you will now receive messages if any one of the following conditions is true: 1) your actual spend reaches 85% of the budget you defined, 2) your actual spend reached 100%, or 3) your forecasted spend is expected to reach 100% of the budget. You can alway go back to the AWS Budgets page to select and modify you budget there, including changing the threshold value. However, here is one important final note regarding the Billing and Budgets dashboards: For some reason, AWS does not update the accumulated costs in real-time. It can actually take multiple hours until the numbers get updated. Nevertheless, this should still help you keep track of how the costs are slowly increasing while you are using the data in your S3 bucket.
-
In the AWS Management Console, go to the search bar at the top of the screen again and now search for S3.
-
Click at the first result that is indeed the S3 service.
-
Once in the S3 service, click the orange button to create a bucket (basically a storage container inside your S3 cloud storage).
-
Under "General configuration", give your bucket a unique name, we recommend starting with "geog585-" followed by some random string of character and/or numbers that you pick yourself. We here will use the name geog585-a1rt15 .
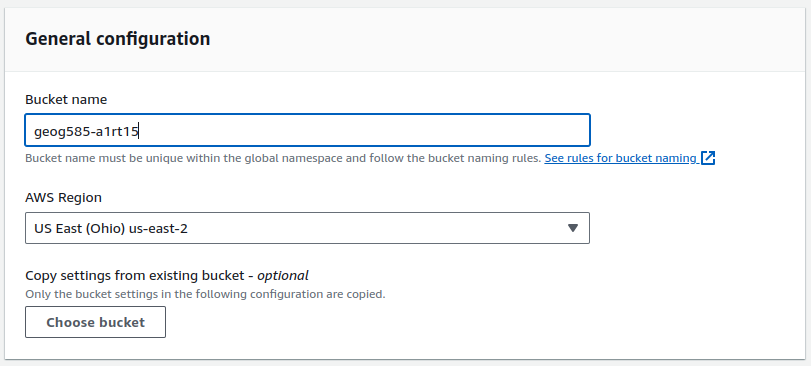 Figure 5.16 S3 bucket create
 -
If you want you can select the region that is closest to you, or in case of a real "global" project the region closest to your clients.
-
Scroll down to where it says Block Public Access settings for this bucket.
-
Usually we want to protect our data, but in this case, the map tiles have to be fully accessible by everyone, so uncheck the first tick to allow access.
-
Tick the box where you acknowledge that the bucket will become public.
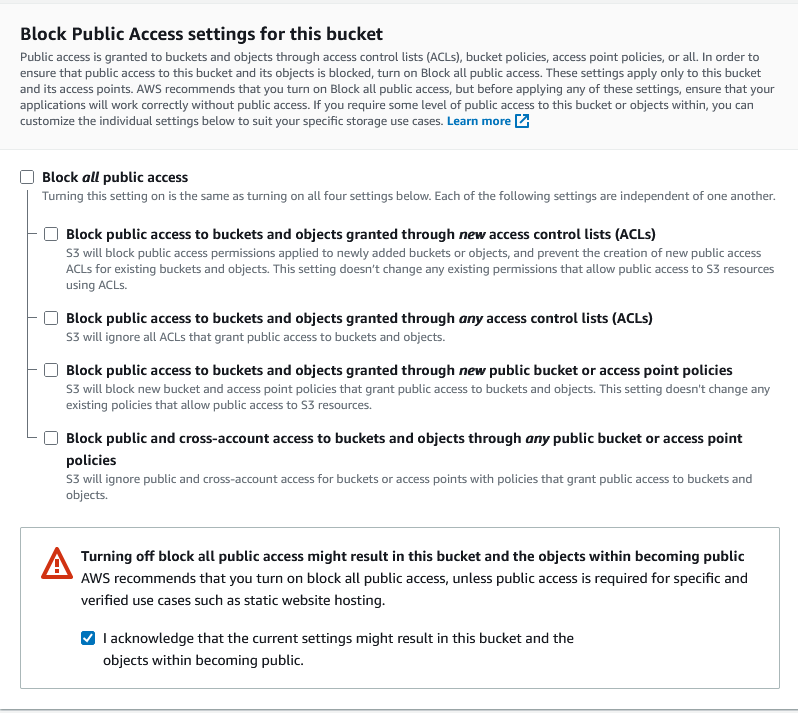 Figure 5.17 Bucket public access settings
-
-
Leave the rest as it is, and scroll down to click Create Bucket.
-
Once back to the main page, you should see your new bucket in the bucket list. Click on the name to open it up.
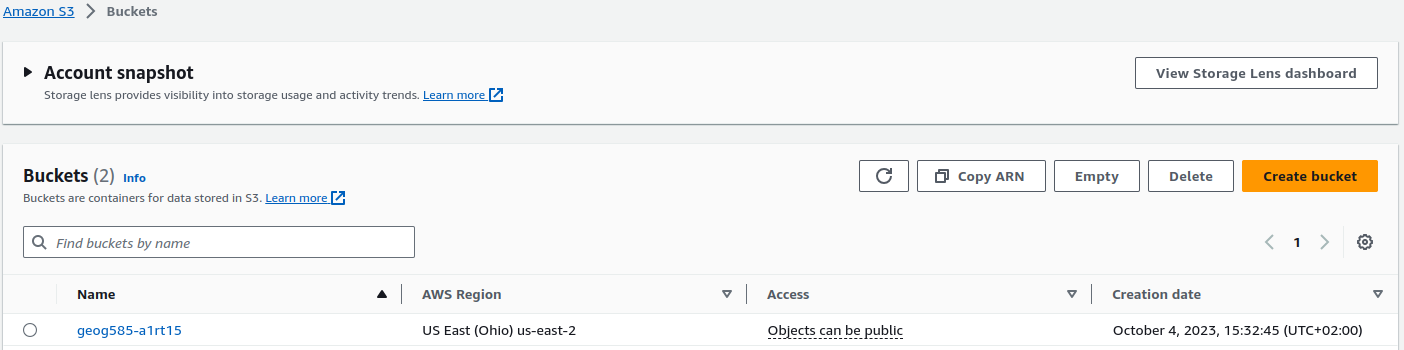 Figure 5.18 S3 Bucket List
 -
You should now see the page for your bucket, currently still not containing any objects. Click the tab called Permissions at the top.
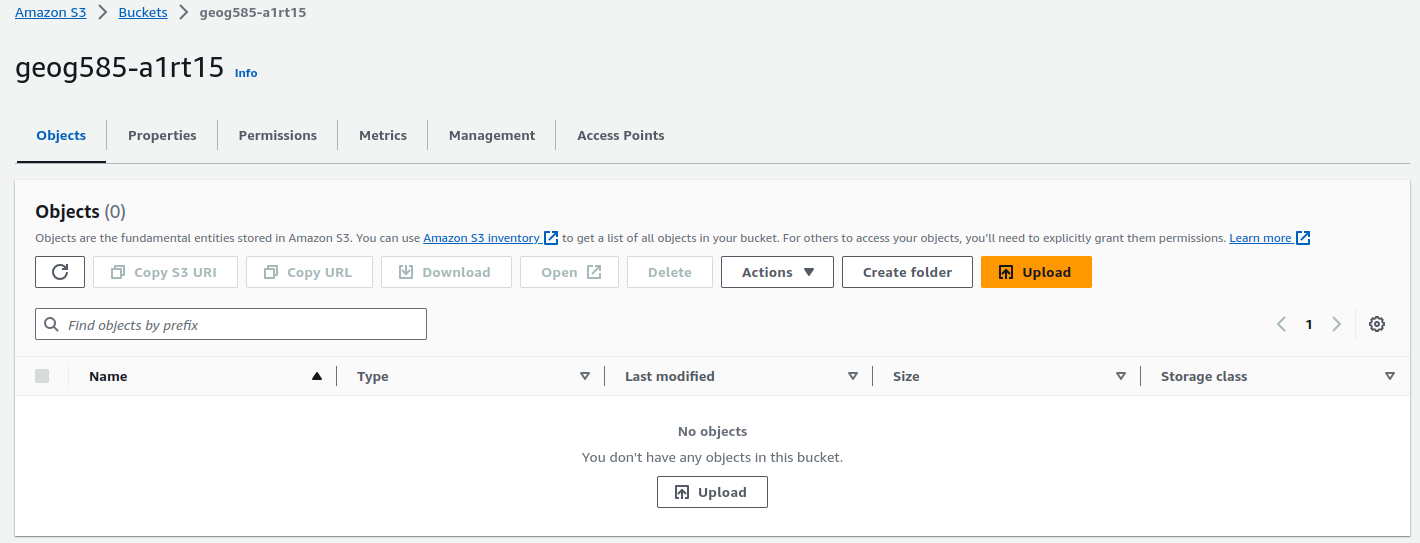 Figure 5.19 Bucket Page
 -
Scroll down to Bucket Policy and click Edit. Amazon really does not want us to create a public bucket unintentionally, so we need to do one more thing.
-
Copy and paste the following in the available space:
{
"Version": "2012-10-17",
"Statement": [
{
"Sid": "PublicReadGetObject",
"Effect": "Allow",
"Principal": "*",
"Action": "s3:GetObject",
"Resource": "arn:aws:s3:::geog585-a1rt15/*"
}
]
}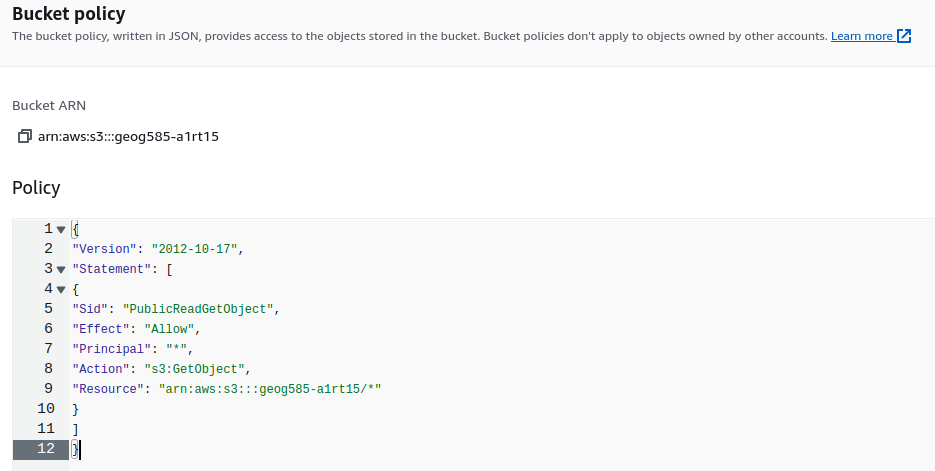 Figure 5.20 Bucket policy
 -
Above the text field and its title "Policy", you can find the ARN name of your bucket. Click the small icon left to it, to copy this name. Then go to the last line of the code you just pasted to change the name of the bucket there. Paste the ARN name you copied to replace the string arn:aws:s3:::geog585-a1rt15 there. Be careful to keep the initial double quote and the /*" after the bucket name.
-
Hit the orange button Save Changes.
-
Now we are almost read to upload our map tiles. If you only want to upload a couple of files (for instance, to upload and share the web map you will create in your Lesson 7 homework assignment), you can do so directly on the AWS page for your bucket by selecting the "Objects" tab at the top (you can think of "objects" as meaning "files" here) and then clicking the Upload button. This will show an area to which you can the drag and drop folder and files from the Windows File Explorer. The AWS will then scan the files and afterwards show you another Upload button that you can press to start the actual upload. However, this approach of using the web page won't work well for basemap tile sets that tend to consist of a huge amount of small files. The Philadelphia tile set, for instance, only is 200MB large in total but it consists of roughly 21,000 files. In our tests, uplading this amount of files via the web interface took around 6 hours.
Therefore, we are going to do the upload via another piece of software, the AWS Command Line Interface (CLI), which is much more efficient for small files and should be able to upload the Philadelphia tile set in just a few minutes. To set this up, we need to do two things: (1) Create a so-called Access Key that will allow us to access our S3 bucket via CLI and (2) install the CLI software itself. Let's start with creating a Root access key...
-
On the AWS page, click on your account name at the very top right of the page and then select "Security credentials". Scroll to the area called "Access keys". Then click the button called "Create access key".
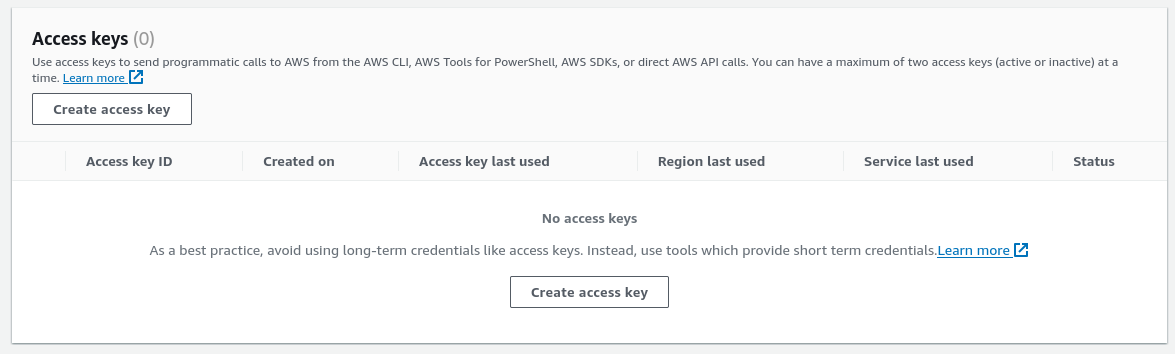 Figure 5.21 Creating access key
AWS will warn you that creating a Root access key is not the best practice. However, we want to keep things simple here, and you can always delete the access key immediately after you have successfully uploaded the files if you want. So please go ahead and enable the checkbox saying that you understand that this is not best practice, then click the orange button saying "Create access key".
-
AWS will now show you a window called "Retrieve access key" with your new access key in plain text and the corresponding secret key hidden by default. You can think of the access key as a login name and the secret key as the password. You will need both for using CLI, so please copy both of them. Important: This will be the only time you will be able to see/copy the secret key. If you loose it, you will have to go back and create a new access key. Once you have the keys stored somewhere else, click the "Done" button at the bottom. To delete or create further access keys, you can always go back to the Access Key area under Security Credentials as in Step 21.
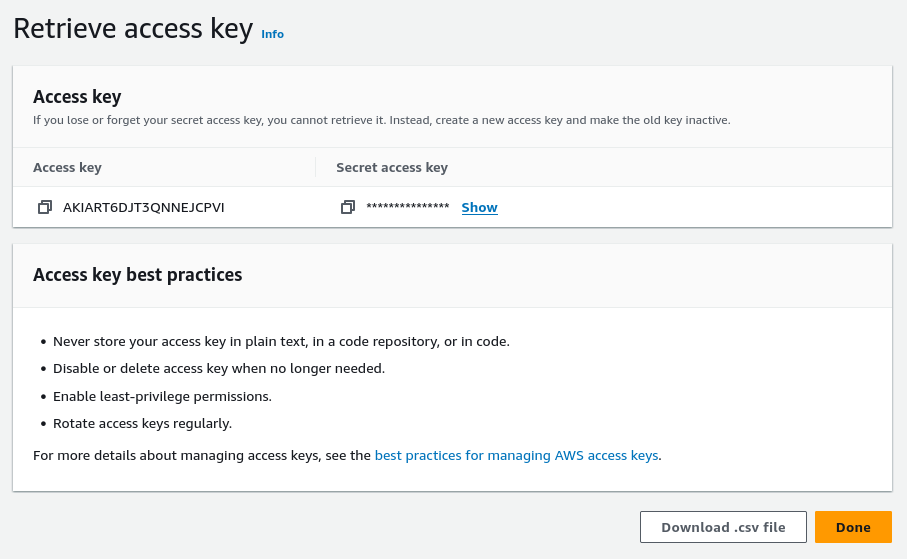 Figure 5.22 Access key and secret key
 -
Now, it is time to install the AWS CLI tools: Click on this link https://awscli.amazonaws.com/AWSCLIV2.msi to download the software.
-
Double-click the downloaded file called AWSCLIV2.msi to start the installation. Then follow the instructions given by the installer.
-
Now open the Windows Command Shell cmd by going to the Windows start menu and typing cmd . This should open the black shell window (see next screenshot below in Step 27).
-
Let's first check if CLI has been installed correctly. Type in the following command and then press ENTER: aws --version
The output should look as shown in the next screenshot below starting with "aws-cli" followed by some version number. -
Next, we have to give CLI some information including the access key and secret key. Type in the following command and then press ENTER: aws configure
You will then be asked for access key, secret key, default region, and default format. For the access key and secret key, copy and paste the keys that you copied from the AWS page in Step 22. For the other two items, you can simply press ENTER without typing in antyhing.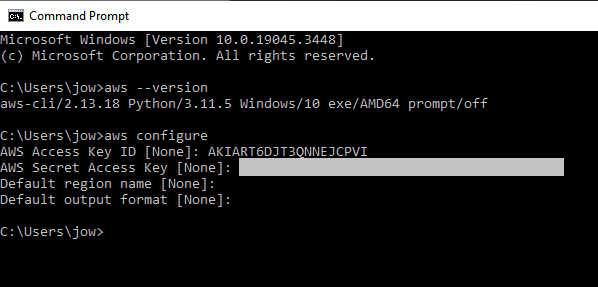 Figure 5.23 Configuring CLI
 -
Now we are ready to upload the files to our bucket. Use the cd command to move to the folder that contains the PhillyBasemap folder to which you exported the tiles in Steps 4+5 from the Section "Exporting the tiles" (see next screenshot from Step 29).
-
Now type in the following command but with the name in bold replaced by the bucket name you used and then press ENTER:
aws s3 cp PhillyBasemap s3://geog585-a1rt15/PhillyBasemap --recursive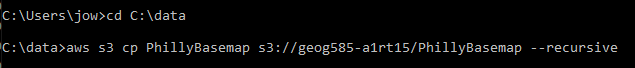 Figure 5.24 Starting the tile upload
 -
You should now see how the tiles are uploading. If instead you get some odd error messages. Try with running the command a second time; somehow this seems to happen sometimes on the first attempt.
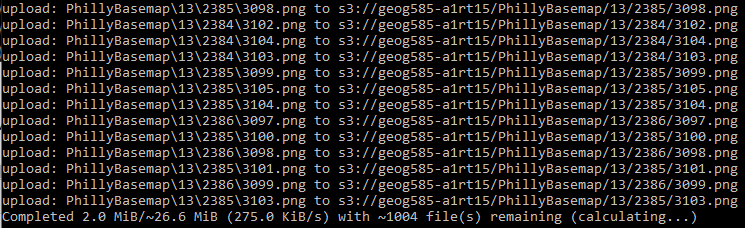 Figure 5.25 Tiles uploading
 -
Once everything is uploaded, you should see a prompt in the cmd shell window. Now switch back to the AWS web page and refresh the "Objects" tab on the page for your bucket. Navigate to the PhillyBasemp folder and then further into the subfolders to one random png tile.
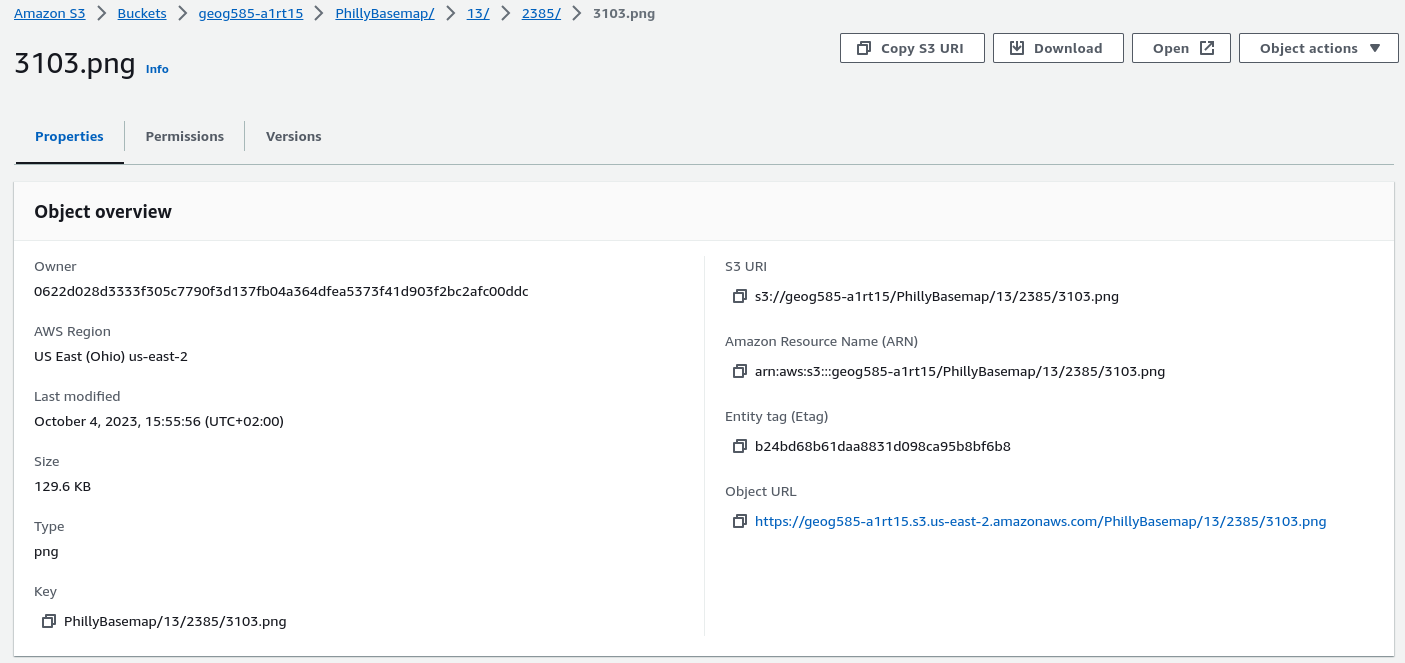 Figure 5.26 Object overview
 -
On the screen that opens, find the Object URL and copy it. The URL is made up of the base URL (https://geog585-a1rt15.s3.us-east-2.amazonaws.com/PhillyBasemap) followed by the folders and file name corresponding to the zoom level and x, y indices of this particular tile image. If you want, you can open a new tab in your browser and copy the URL into the address bar to open this one tile. You should see the tile image but keep in mind that you have picked an empty tile so that you will just get an image that is fully white. To later use your basemap tiles in a web map you, you will have to take the base URL and then replace the concrete numbers at the end with a string of variabels to create a template string, for instance looking like this: https://geog585-a1rt15.s3.us-east-2.amazonaws.com/PhillyBasemap/{z}/{x}/{y}.png . We will make use of this option in the final part of this walkthrough in which we will test out our tiles in an ArcGIS Online map.
-
GOOD JOB! You are done!!
Testing the tile set in an ArcGIS Online map
- Open a browser to ArcGIS and click the Map link at the top of the screen. You'll see an Esri-provided map, which we will switch out for our Philadelphia basemap. On the top right, select Open in Map Viewer Classic, so you can work and test your tiles without logging in.
- Click Add > Add Layer from Web. (If you don't see an Add button, first click the Modify Map link.)
- Choose to add data from A Tile Layer, and then populate the dialog box as shown below but using the base URL for the tiles in your own bucket from Step 32 in the previous section. Make sure to keep the /{level}/{col}/{row}.png part though. Note that ArcGIS Online uses different variable names (level, col, row) compared to the example given in Step 28 and what you will see in Leaflet in the next lesson. Also note that to set the extent, you must click Set Tile Coverage and draw a box around Philadelphia. You don't need to get the exact same coordinates shown below.
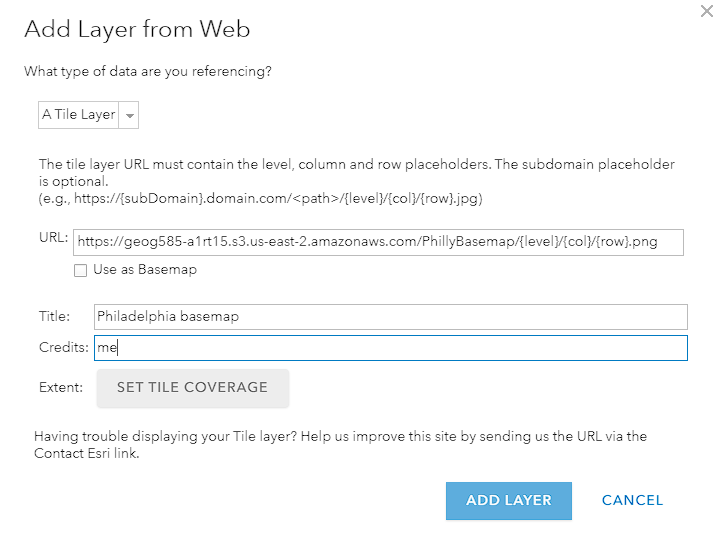 Figure 5.27 Add Layer from Web GUI in GeoServer
 - Click Add Layer. If nothing happens for a long time, repeat and make sure there is no error in the URL field. Navigate around your Philadelphia map to test it out. If you turn on the network utility of your browser's developer tools, you should be able to see the tiles being brought into the map.
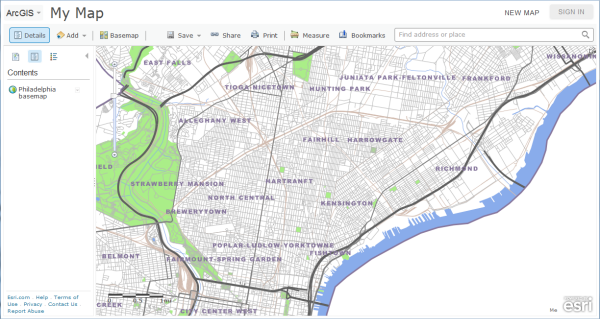 Figure 5.28 Sample map output
Optionally, you could add other web layers on top, but, for the sake of time, this will not be described here. In future lessons, you'll learn how to build this type of web map programmatically without using ArcGIS.com.