Now that you are finished with this week's project, you may be interested to know that some of the tools you've been using are available in ArcGIS. You will find mean nearest neighbor distance and Ripley's K tools in the Spatial Statistics - Analyzing Patterns toolbox. The Ripley's K tool in particular has improved significantly since ArcGIS 10, so that it now includes the ability to generate confidence envelopes using simulation, just like the envelope() function in R.
For kernel density surfaces, there is a density estimation tool in the Spatial Analyst Tools - Density toolbox. This is essentially the same as the density() tool in R with one very significant difference, namely that Arc does not correct for edge effects.
In Figure 3.11 the results of kernel density analysis applied to all the crime events in the project data set are shown for (from left to right) the default settings in ArcGIS, with a mask and processing extent set in ArcGIS to cover the city limits area, and for R.
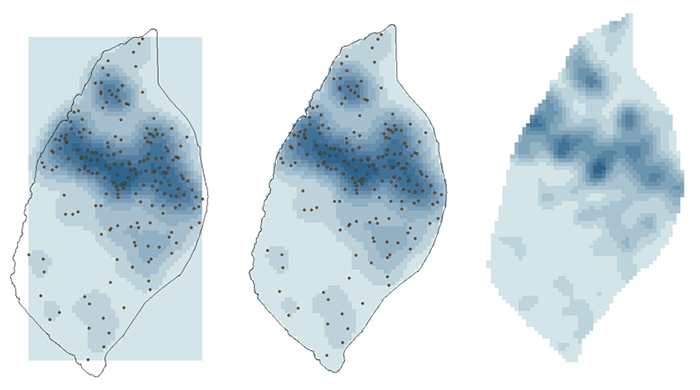
The search radius in ArcGIS was set to 2 km and the 'sigma' parameter in R was set to 1 km. These parameters should give roughly equivalent results. More significant than the exact shape of the results is that R is correcting for edge effects. This is most clear at the north end of the map, where R's output implies that the region of higher density runs off the edge of the study area, while ArcGIS confines it to the analysis area. R accomplishes this by basing its density estimate on only the bandwidth area inside the study area at each location.
Descriptive Spatial Statistics in ArcGIS:
The descriptive spatial statistics tools can be found in the Spatial Statistics – Measuring Geographic Distributions toolbox in ArcToolbox. To do this analysis for different crime types or different time periods (year, month) set the case field.
The extensibility of both packages makes it to some extent a matter of taste which you choose to use for point pattern analysis. It is clear that R remains the better choice in terms of the range of available options and tools, although ArcGIS may have the edge in terms of its familiarity to GIS analysts. For users starting with limited knowledge of both tools, it is debatable which has the steeper learning curve - certainly neither is simple to use!