Efficient Use of Personnel in a Project
Overview
The most interesting, unpredictable, and expensive resource you are likely to work with as a project manager is people. Individuals and their interactions can greatly influence either the success or failure of any project. So, how do you manage them? We will begin by discussing how to develop a human resource plan for a project, and then we will discuss how personnel and interpersonal relationships in an organizational setting can be better understood. A first step would be to organize the individuals who will be working on a project.
Project Organization Charts
A project organizational chart is similar to an organizational chart we discussed in Lesson 2. This document should clearly lay out who reports to whom, based on an individual's role and responsibility within the project. If you are managing the project, you will be at the top of the project organization chart, and ultimately responsible for the success of the project. For projects that involve outside contractors, client organizations normally require those contractors to prepare a project organization chart showing the roles of team members and relationship with client project personnel. Figure 4-1 shows a "standard" project organizational chart showing the main elements that are often included in GIS projects. The box in the middle is the project team, led by an assigned project manager. This structure shows the project's team position in the organization—inside the "program management unit" which may be a formal GIS Office. The project team uses and manages work and products provided by contractors and vendors and communicates with external organizations may have a role in the project (e.g., review and comment on project deliverables). The box in the upper right, "Project Management Office" is an organizational unit which some government and private sector organizations set-up to provide support and oversight in project planning and execution.
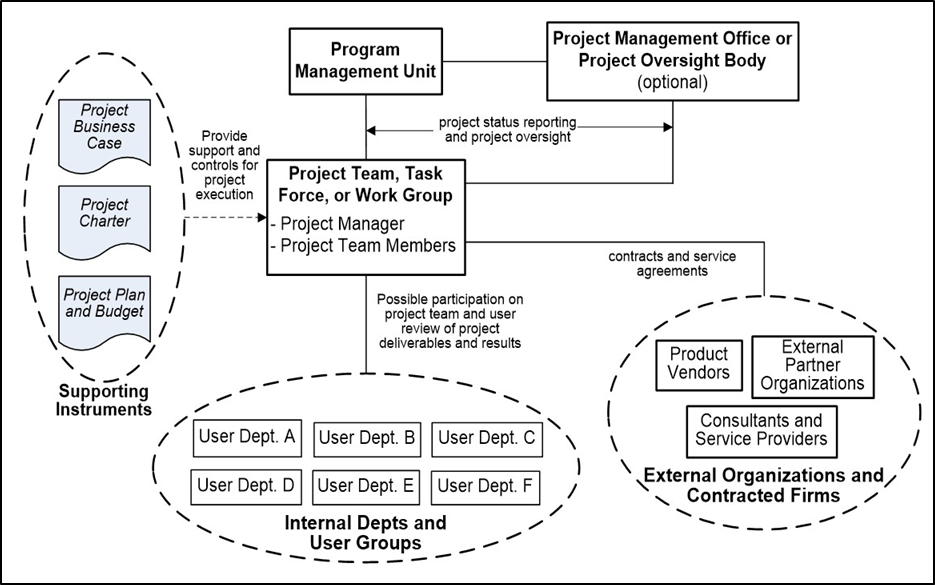
Click for text description of Figure 4-1: Model GIS Project Structure
This figure is an organizational chart with boxes and connecting lines showing the main parts of a model project management structure. This includes the "project team" or "work group" with oversight by an organizational unit, the relationship with users (or stakeholders) inside the organization, external entities that may have a role in the project. The project team or work group consists of an assigned project manager and team members, who may come from any part of the organization. The project team reports to a specific "program unit" — a Department or Division assigned responsibility for project oversight. The project team coordinates and communicates with project stakeholders (internal Departments and users) who play a role in the review of project deliverables. Typically, external entities with which the project team also communicates include vendors of IT products like software, other contracted companies, and external organizations that have an interest in the project. Key documents that enable or support the project include the project charter, business case, and project plan. The box in the upper right shows an optional project management office (PMO). Some government organizations and private companies have established PMOs to provide support and best practices in project planning and management.
Figure 4-2 is an example of a project team structure for a GIS project-in this case, a contracted company providing GIS consulting services for a City government department.
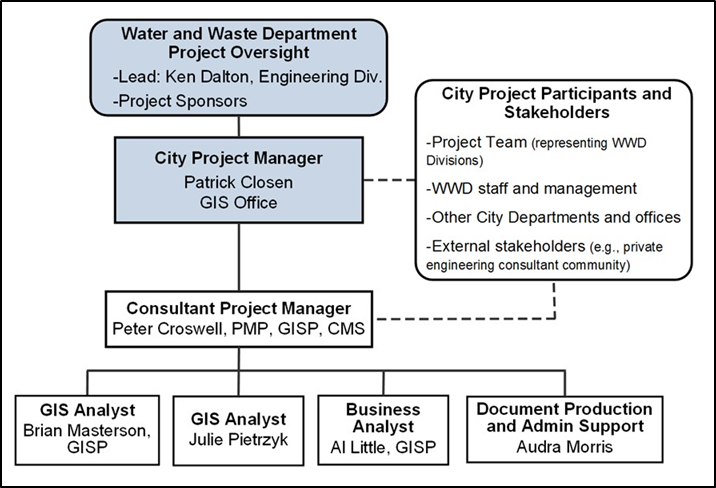
Click for text description of figure 4-2: Example of Project Team for GIS Project
The figure is an actual example of a project organizational chart for a municipal GIS project. A box at the top shows the senior management sponsor overseeing the project, which connects to a box below representing the City Project Manager in the GIS Office, which is the organizational "program unit" responsible for directing the project. Much of the work for this project is being carried out by a consultant team hired by the City. Below the City Project Manager box, there are boxes that show the consultant project manager and individual boxes for consultant team members. The box to the right, which connects to the City Project Manager box and the Consultant Project Manager box, shows the main project stakeholders and participants, including staff of the Water and Waste Department, other City Departments, and external groups—including private engineering companies.
Assembling Project Teams
For better or worse, there are generally important inherent differences between the means of influencing employees as a project manager and as an organization manager. You may have limited or no influence over professional incentives for members of your project, such as salary or promotions. Even more challenging, you may not have the final say over time commitments of workers to the project. This underscores the importance of a project charter, where such issues should be clearly laid out for and signed off on by management and sponsors in the organization.
Beginning with a role and responsibility matrix (also called a "resource matrix") and a project organization chart, you can move towards ever more detailed personnel assignments regarding who will accomplish what tasks and when. A project plan generally contains this information in a Work Breakdown Structure, which we will discuss in Lesson 5. In assigning personnel, you may not always have people with the talents or skills you desire within your organization. Training, education, or professional development of existing personnel is one way to overcome this shortfall. Other times, you may need to hire qualified personnel on a temporary or permanent basis. If hiring is required, you will need to clearly outline education, skills, and experience that match the roles and responsibilities the employee will inherit in the organization.
Many public sector organizations and private companies have established formal GIS position descriptions. Common job titles include "GIS Manager", "Geographic Information Officer (GIO), "GIS Analyst", "Senior GIS Analyst", "GIS Developer/Programmer", "GIS Technician", "GIS Specialist", "GIS Database Administrator", and "GIS Systems Administrator". Croswell (2022), Appendix I has some examples of GIS positions. Also, a Web search using some terms as "GIS position description" will turn up examples used in specific organizations.
Croswell (2022), subsections 4.1 and 9.1 provide a thorough summary of considerations and approaches for staff GIS programs and projects and the organization of team members in projects. Staffing GIS projects can be a challenge, particularly if in-house resources are limited. For organizations with a central GIS Office (like a local government enterprise GIS program), a project manager for a new project will often be a staff person in that GIS Office. The project team will usually include some other GIS staff (from the GIS Office) but often may include staff members from user Departments with specific skillsets. Sometimes, contracted personnel may also be on the project team.
Once tasks and their timing have been detailed, it is possible to optimize human resources using the tools of resource loading and resource leveling. Resource loading refers to how much of individuals' time is committed to projects during various periods. Optimally, every employee of an organization would have 100% of his or her time allocated during all working hours. In reality, it is very easy for employees to be over-allocated. In many organizations, it can be detrimental in many other ways for employees to be under-allocated, especially if it has an undesired effect on their hours worked and resulting paycheck.
Resource Leveling
A strategy to optimize personnel allocation is Resource leveling, which resolves conflicts with resources by changing the scheduled times. By having personnel perform tasks on later or earlier dates, managers can take steps toward leveling all personnel at 100% allocation. It should be noted, however, that tasks within a project are often dependent on one another and cannot always be moved arbitrarily without adversely influencing the project schedule. We will discuss this in greater detail in Lesson 5 when we talk about network diagrams and critical paths. Figure 4-3, below, shows an example of the benefits of resource leveling.
In our discussion of resource leveling, we will assume that the rectangles representing worker-days (or worker-weeks, worker-hours, etc) are able to be modifiable in dimensions as long as the area of the resulting worker-week rectangle stays the same. For example, if a task requires 8 worker-weeks to complete, this could be accomplished by one qualified person working on this for 8 weeks, 8 qualified people working on the same task for one concurrent week, or any other combination whose sum is 8 (e.g. 2 workers for 4 weeks, 4 workers for 2 weeks). Although this makes assumptions about how the task can be accomplished, it also provides the project manager with flexibility and potential efficiency when it comes to leveling resources.
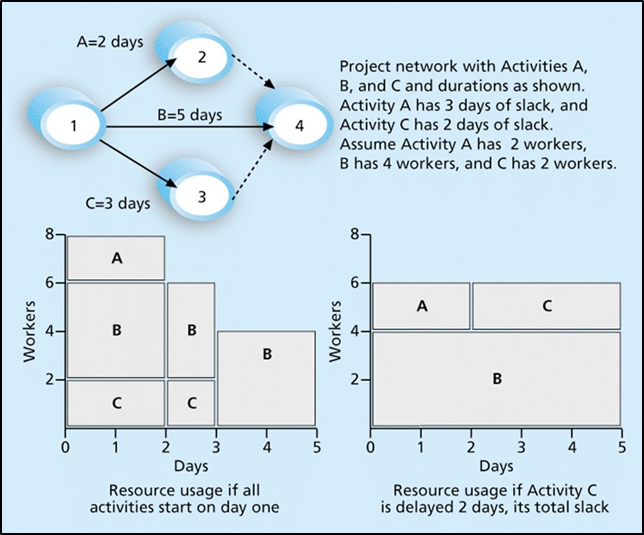
Click for text description of Figure 4-3: Resource Leveling Example
This figure explains the concepts of resource usage and resource leveling, addressing the way in which project team members (workers) are assigned to project tasks. The top part of the diagram shows worker days associated with 3 hypothetical project activities (A, B, and C) with the assumption that Activity A has 3 days of slack, Activity B has 2 days of slack, and Activity C has 2 days of slack. The bottom part of the diagram includes two graphs, each with the X-axis is elapsed days for the project activities (duration), and the Y-axis is the number of workers. The graph to the left represents resource (worker) usage if all activities start on Day 1. In this case, Activity A is completed at Day 2, Activity B is completed in Day 5, and Activity C completes at Day 3. The graph on the right shows resource usage if Activity C is delayed 2 days. In this case, Activity A is completed at Day 2, Activity B is completed in Day 5, and Activity C completes at Day 5.