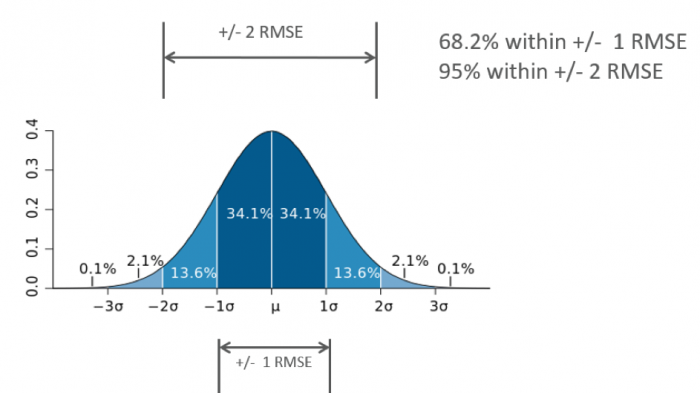
Normal Distribution Curve
In randomly distributed repeated measurements, measurements values will vary around the mean or the average, with most values being closer to the average. Deviation from such behavior indicates the presence of bias(es) or perhaps blunders in the measurements. Figure 4 shows a true random distribution of a set of measurements that do not contain biases. For the measurement’s distribution in Figure 4, we notice that 68.2% of the measured values fall within +/- 1 RMSE or +/- 1 sigma from the mean value, that is 34.1% on both sides of the mean. We also notice that 95% of the measurements fall within +/- 2 RMSE or +/- 2 sigma from the mean. Understanding such distribution is essential to understanding the map accuracy standard we are going to discuss in the following sections.