Print
1.1 Exploring Digital Elevation Model
-
Download Lesson6.gdb and unzip the file, then save it to the main project location.
(C:\Users\YOURUSER\Documents\ArcGIS\Projects\ UniversityParkCampus).
- Open UniversityParkCampus_Lesson6 Project in ArcGIS Pro.
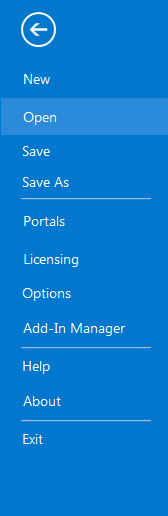
- Click the Project tab. Select Save As.
 Credit: 2019 ArcGIS
 - In the Projects Folder (C:\Users\YOURUSER\Documents\ArcGIS\Projects\ UniversityParkCampus), Save Project as UniversityParkCampus_lesson6_Flood. This way you will create a new project for the first section of this lesson.
- Go back to the Map view.
- Turn on the Smoothed_DEM layer.
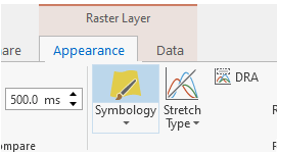
- To get a better idea of elevation around campus, click on the band color value under Smoothed_DEM. Then, on top ribbon, click on appearance and select symbology.
 Credit: ArcGIS, 2021
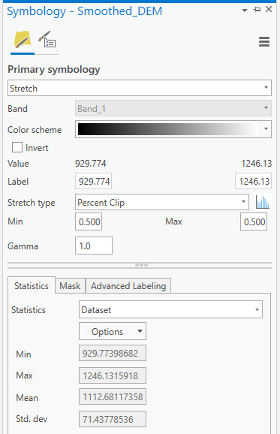 Credit: ArcGIS, 2021
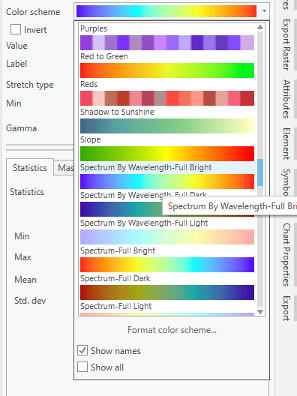
Change the color scheme to Spectrum by Wavelength-Full Bright. You can turn on Show names to see the names on top of each color scheme.
 Credit: ArcGIS, 2021
 -
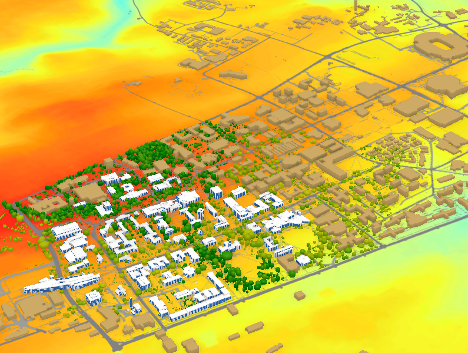
Go back to the Map_3D. Change the color scheme of Smoothed_DEM to Spectrum by Wavelength-Full Bright. Make sure that UP_Roof_Section and Building_Footprint layers are turned on. As you can see, the areas with higher elevations have warmer colors. It means that buildings located in the southern part of campus are more likely to be affected by flood, if we consider all the buildings in the same flood plain.
 Credit: ChronoPhronesis Lab