2.2 Sun Shadow Volume Analysis for January 1st
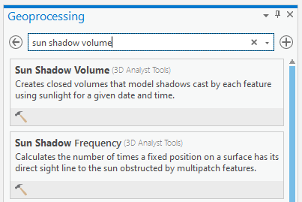
- On the top ribbon, click the Analysis tab and select tools. Search Sun Shadow.
-
Select Sun Shadow Volume (3D Analyst Tools).
 Credit: ArcGIS, 2021
 -
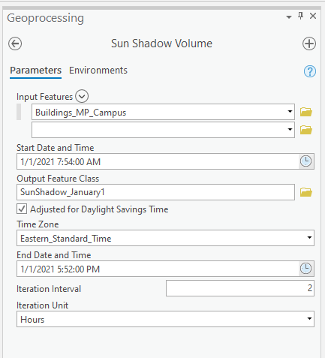
You will use the multipoint feature ‘Building_MP_Campus’ as an input. On January 1st, 2021 the sunrise is at 7:54 am and sunset is 5:52 pm. Set the start and end date as below. Pennsylvania is in the Eastern Standard Time zone. Change the Iteration Interval to 2 and Iteration Unit to Hours. Click Run.
 Credit: ArcGIS, 2021
 -
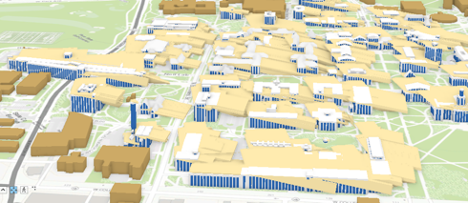
Turn on UP_Roof_Segment and turn off Building_Mp_Campus. Change the color of SunShadow_January to ‘Topaz Sand’. Right-click on the layer, select Properties. Click Elevation and make sure the features are relative to the ground. This is the result of your analysis.
 Credit: ChoroPhronesis Lab
 - Open the attribute table and you will see the fields that are attributed. The fields are explained in detail on the ArcGIS Pro website. Here is the explanation for each field:
- SOURCE—Name of the feature class casting the shadow volume.
- SOURCE_ID—Unique ID of the feature casting the shadow volume.
- DATE_TIME—Local date and time used to calculate sun position.
- AZIMUTH—Angle in degrees between true north and the perpendicular projection of the sun's relative position down to the earth's horizon. Values range from 0 to 360.
- VERT_ANGLE—Angle in degrees between the earth's horizon and the sun's relative position where the horizon defines 0 degrees and 90 degrees is directly above.4
- Close the attribute table.
- To make sense of the results of the shadow volumes, you need to symbolize the layer based on the time of day (every 2 hours position of the sun in the local date). On the content pane, click on the symbology under SunShadow_January1.
-
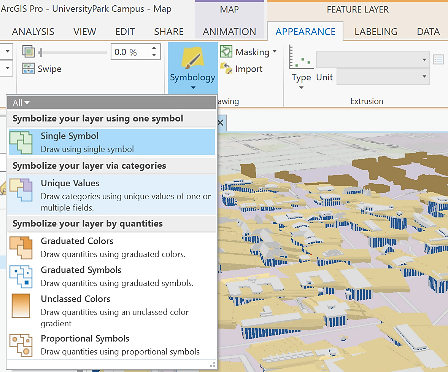
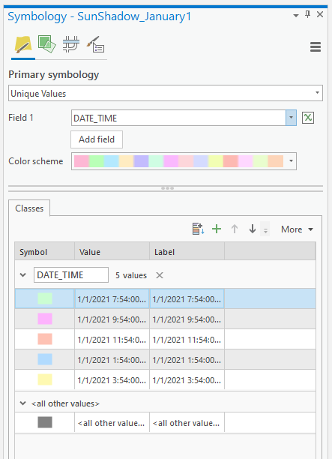
On the top ribbon, under appearance, click Symbology. Select Unique Values.
 Credit: 2016 ArcGIS
 - On Symbology pane on the right side of ArcGIS Pro, select DATE_TIME as Value field.
-
Select set 3 for the color scheme.
 Credit: ArcGIS, 2021
 -
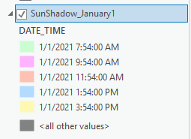
On the content pane or in the symbology pane you can explore the categories.
 Credit: ArcGIS, 2021
The first category is the shadow created by the sun at 7:54 am and the last one is the shadow created at 3:54 pm. Because of the overlaying layers, you cannot see each shadow clearly.
-
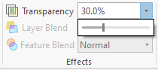
On the top ribbon, click appearance. In Effects Category, define Layer Transparency as 30%.
 Credit: ArcGIS, 2021
Making a Layer transparent, you can see different shadow volumes easier. However, there are more efficient ways to see your results.
ArcGIS Pro offers a few ways to show an area of interest for your data, including visibility ranges, definition queries, and range. To visualize your data as a dynamic range, you can use any layer, or set of layers, that contain numeric, non-date fields. Once you define the range properties for your layer, an interactive, on-screen slider is used to explore the data through a range you customized’.5
-
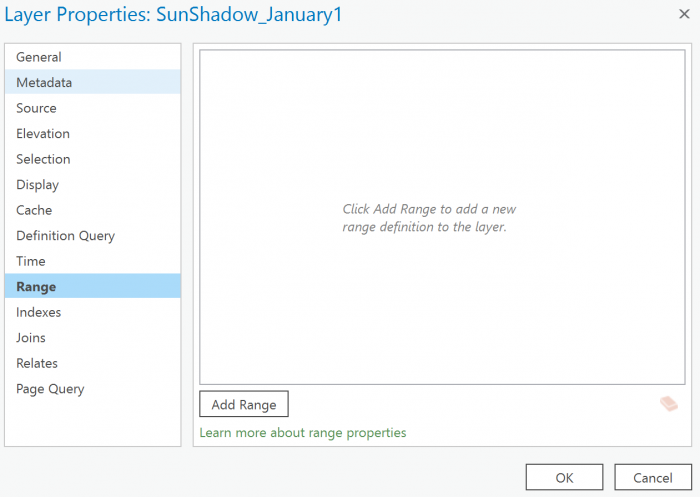
On the content pane, right-click on SunShadow_January1 layer and select properties. Click the Range Tab. Setting the range properties of the layer, you can explore the data interactively using a range slider.
 Credit: 2016 ArcGIS
 - To do so, you will choose a field by clicking add range. The range can be set by any numerical field. Therefore, you cannot choose DATE_TIME as a field for range.
-
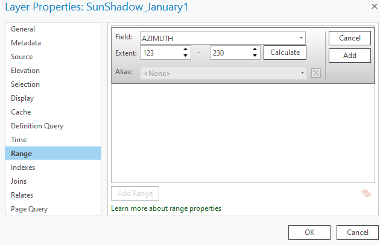
Click Add Range. Click the drop-down menu of Field. You will see that DATE_TIME is not in the list of fields that can be used because it is not a numerical field. You can select Azimuth. Set the extent from 120 to 236. Click Add. Click OK.
 Credit: ArcGIS, 2021
 -
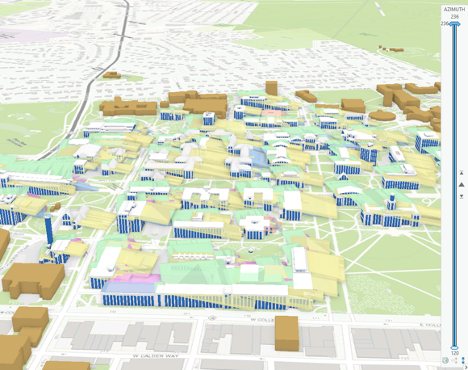
Defining a range, you will be able to use a tool in ArcGIS Pro called Range Slider. This tool gives you the ability to filter overlapping content to make it more accessible and visible. You can see the Slider on the right side of your map.
 Credit: ChoroPhronesis Lab
 -
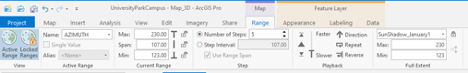
To set the Slider, on the top ribbon, under Map, click Range. Under Full Extent choose Sun Shadow_January1. Make sure the min and max are set to 120 and 236.
 Credit: ArcGIS, 2021
 - Playback defines the speed and direction of the range on the Range Slider to move.
- If you set the current range from 120 to 230. The span becomes 107. Set the number of steps to 5.
-
Make sure the active range is Azimuth, the same field you defined in layer properties.
Check Your Understanding
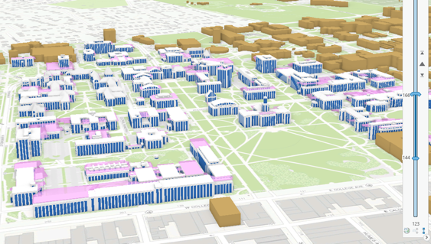
Take a look at your map. You can see the first visible range now is from 123 to 144. This azimuth range belongs to the first hour of the sunrise from 7:54 am to 9:54 am
Where is the shadow's direction of the first range? (From 7:54 am to 9:54 am)
Click for the answer.North West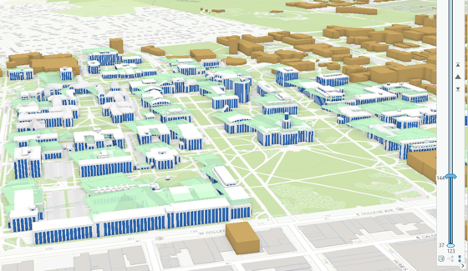 Credit: ChoroPhronesis Lab
 - Click next on your slider and you can see the next result:
 Credit: ChoroPhronesis Lab
This belongs to 8:35 am to 9:54 am. If you continue with the Range slider, you can see all 5 categories of time frames.
-
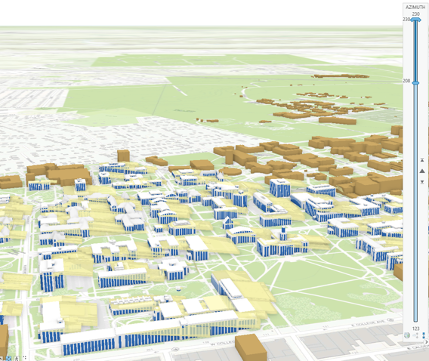
The last step shows you the changes in shadow volume and its direction towards the end of the day. The shadow moves from North West in the morning to the East towards the end of the day.
 Credit: ChoroPhronesis Lab
 -
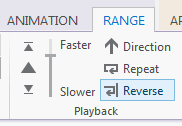
Instead of clicking next, you can play the slider and it will play ranges after each other with the pace you have chosen. The pace, from slower to faster can be defined on the top ribbon, Range tab.
 Credit: 2106 ArcGIS
 -
Here is the video of how the shadows of University Park Campus buildings move from sunrise to sunset on 01/01/2021.
Video: Sun Shadow January 1 2021 (00:37) This is video is not narrated. -
You have learned how to change symbology in Lesson 5. To make a more presentable animation of the shadow volumes, define the symbology of ‘SunShadow_January1’ using a gradual color change from lighter colors to darker colors. You need 5 gradual colors; for instance, you can choose a color ramp of Blue or Orange or Green or any other color you find appropriate.
Note: make sure to change the current range from 123 to 230 to see all shadow calcifications under the ‘SunShadow_January1’ layer.
- Make a Screenshot of Campus with gradual symbology of SunShadow_January1. Copy and paste the screenshot into your Word document and label it Task 2.
- Save your Project.