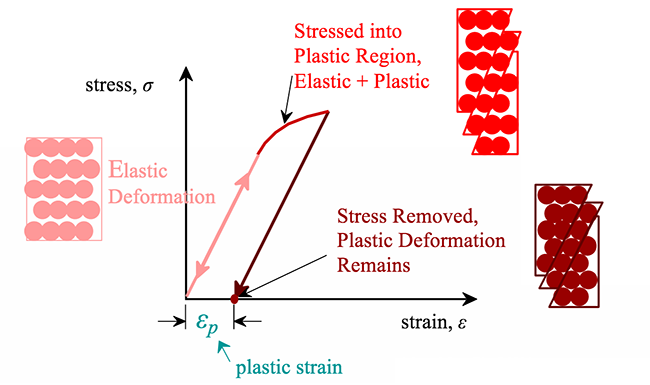
For most metallic materials, the elastic deformation region is relatively small. At some point, the strain is no longer proportional to the applied stress. At this point, bonds with original atom neighbors start to break and reform with a new group of atoms. When this occurs and the stress is relieved, the material will no longer return to its original form, i.e., the deformation is permanent and nonrecoverable. The material has now moved into the region referred to as plastic deformation. In practice, it is difficult to identify the exact point at which a material moves from the elastic region to the plastic region. As shown in the figure below, a parallel line offset by 0.002 strain is drawn. Where that line intercepts the stress-strain curve is identified as the yield strength. The yield strength is equal to the stress at which noticeable plastic deformation has occurred.
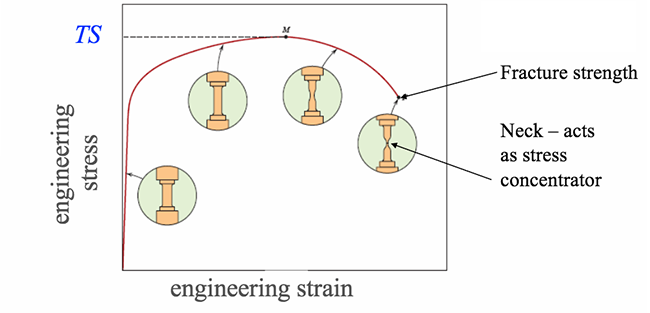
For many materials, the stress-strain curve looks like the curve shown in the figure below. As the stress is increased from zero, the strain increases linearly until it starts to deviate from linear at the yield strength. For increasing stress, the curve proceeds to a maximum at which point it curves downward toward the fracture point. The maximum corresponds to the tensile strength, which is the maximum stress value for the curve and is indicated by M in the figure. The fracture point is the point at which the material ultimately breaks, indicated by F in the figure.