4.2 Changes in Atmospheric Composition
Since the Earth was formed more than 4 billion years ago, the atmosphere has changed profoundly. A wide variety of geochemical and ecological (fossil) evidence indicates that oxygen levels rose dramatically about 2 billion years ago. Such evidence also indicates that carbon dioxide levels were much higher earlier in Earth's history, which allowed the Earth to be at a habitable temperature despite the fact that the output from the Sun was much lower (about 25%) compared to today, resolving the so-called "Faint-Young-Sun Paradox." Below we discuss changes in atmospheric composition over the past 800,000 years, the past few hundred years, and the past several decades.
Changes over the past 800,000 years
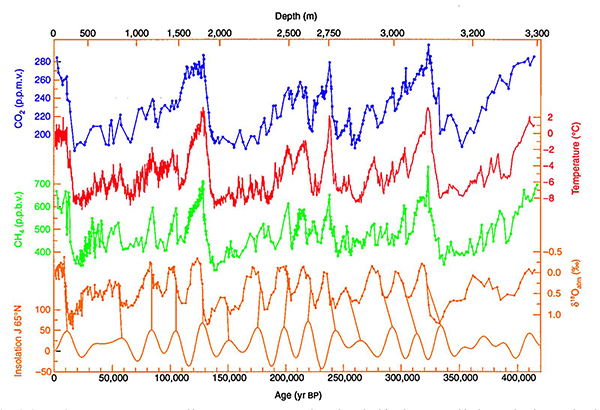
We have learned a lot about how atmospheric composition has changed from measurements of gases in bubbles trapped in ice cores. The figure below, which shows such measurements from an Antarctic ice core, reveals that two key greenhouse gases, CO2 and CH4, underwent large, rapid variations over the past 400,000 years. The variations are also periodic, with a rapid decline followed by a more gradual increase every 100,000 years or so, and are in roughly in phase with the temperature and out of phase with ice volume. The periodic variations reflect the coming and going of the ice ages. Similar cycles have been measured as far back as 800,000 years for CO2 and CH4 and other fossil evidence suggests that the current period of ice ages that we are in now began about 2.6 million years ago. These changes in CO2 and CH4 were driven ultimately by changes in the Earth's orbit and axis of rotation, which led to changes in the amount of solar radiation received at various latitudes during various seasons. Summer solar radiation at high northern latitudes is particularly important (bottom curve below), because it regulates how the large northern hemisphere ice sheets grow. These changes in solar radiation led to changes in Earth's temperature, ocean circulation, and other processes that influence atmospheric CO2 and CH4, which amplified the changes in Earth's temperature.
Changes over the past few hundred years
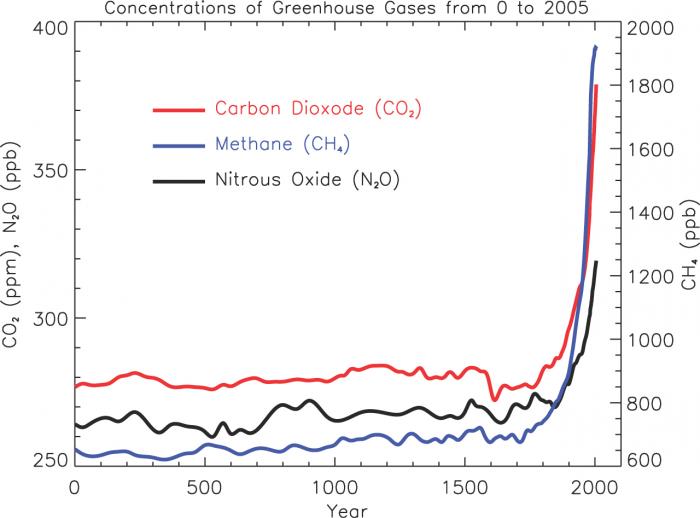
The Holocene period began about 12,000 years ago, at the end of the last ice age, and marks a period of relative stability in climate and atmospheric gas concentrations. During this time, the ice core data reveal that levels of CO2 and CH4 in the atmosphere were relatively constant, at about 280 ppmv and 650 ppbv, respectively. Then, as shown below, levels of both gases, as well as another greenhouse gas, nitrous oxide (N2O), increased rapidly about 200 years ago. These increases, which coincide with the industrial revolution, were due to anthropogenic activity, including the burning of fossil fuels and enhanced deforestation and agriculture. The increases in these three greenhouse gases are the primary cause of the warming of the Earth by about 1 oC over the past century.
Ice core data reveal many other interesting changes in the atmosphere that occurred during the last 200 years or so, particularly in the Northern Hemisphere. For example, within the ice itself, one can see increases in the amount of nitrate and sulfate, which are produced ultimately from the combustion of fossil fuels. These constituents are the key components of acid rain and, indeed, data from the same ice core also reveal an increase in acidity.
Changes over the past several decades
Changes in the composition of the atmosphere over the past several decades primarily reflect changes in human activity.
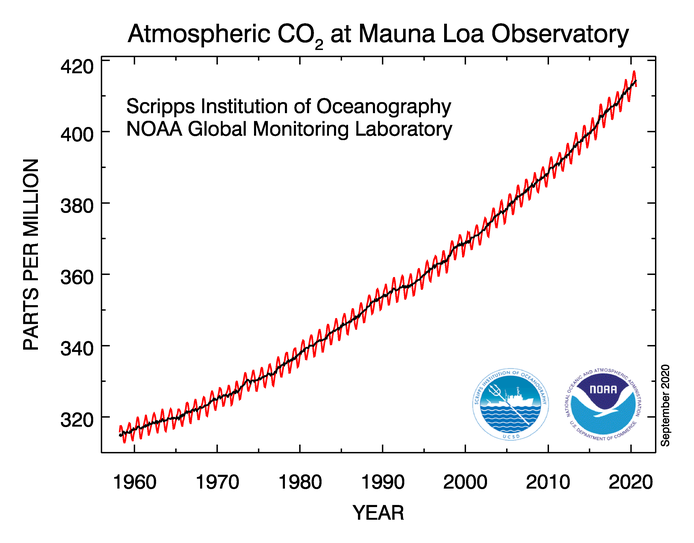
As fossil fuel emissions have increased over recent decades, so has the growth rate of atmospheric CO2, as indicated by the concave-upward curvature in the figure below. The growth rate has approximately doubled from about 1 ppmv per year in the 1960s to about 2 ppmv per year in the 2000s. According to the Global Carbon Project, 86% of the anthropogenic CO2 emissions during 2009–2018 were from fossil fuel burning and 14% were from land-use change (e.g., deforestation). However, CO2 injected to the atmosphere from human activity does not stay there. 44% of the emissions from human activity during 2009–2018 accumulated in the atmosphere, 29% were absorbed by terrestrial ecosystems, 23% were absorbed by the ocean, and 4% is unaccounted for (Global Carbon Project). Superimposed on the accelerating trend over the past few decades is an annual cycle in which CO2 declines during Northern Hemisphere summer and rises during most of the rest of the year. This cycle reflects photosynthesis (an atmospheric CO2 sink) and respiration (an atmospheric CO2 source) of terrestrial ecosystems in the Northern Hemisphere, where most land is present. Note that the current increase to above 400 ppmv now extends well above any other time in the past half 800,000 years, at least, when CO2 varied between about 180 and 280 ppmv.
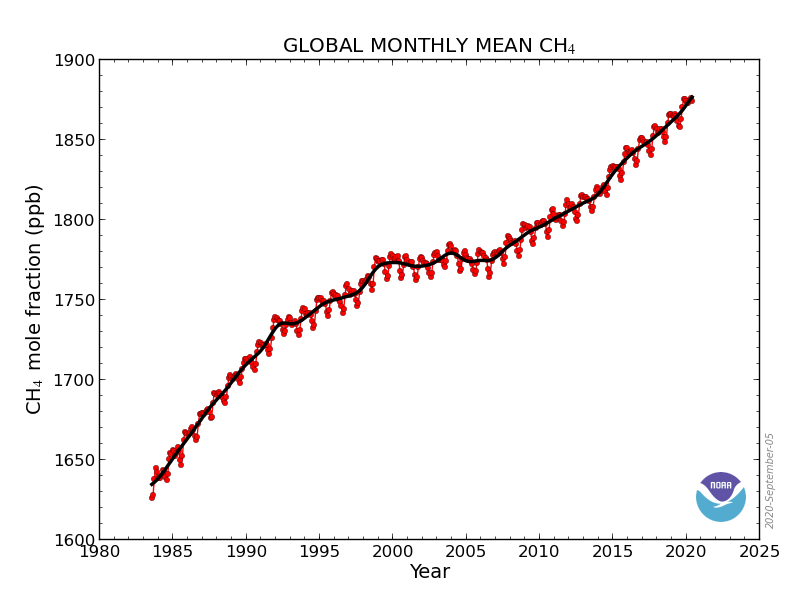
The changes in methane over the past several decades are more complex than those of carbon dioxide. The figure below shows that the methane growth rate (the slope of the curve) gradually declined from the 1980s to roughly zero by the mid 2000s. Since then, the growth rate has increased, though it is still not as high as it was in the 1980s. A detailed budget of methane has been developed by the Global Carbon Project and indicates that for 2008–2017 about 60% of the methane sources were anthropogenic (mainly from agriculture, waste, fossil fuel production and use, and biomass burning) and 40% were natural (mainly from wetlands, inland waters, geological sources, ocean, termites, wild animals, permafrost, and vegetation). The main sink of methane is oxidation by OH, which we will discuss later in this lesson, as well as consumption within soils. Despite our basic understanding of methane sources and sinks, we do not know why the methane growth rate has changed in the way it has over the past several decades. This is an important unresolved problem, because methane levels are very high currently. In 2019, the global-average methane mixing ratio was more than 1860 ppbv, which is well above values over the last 800,000 years, at least, which varied between about 400 and 700 ppbv.
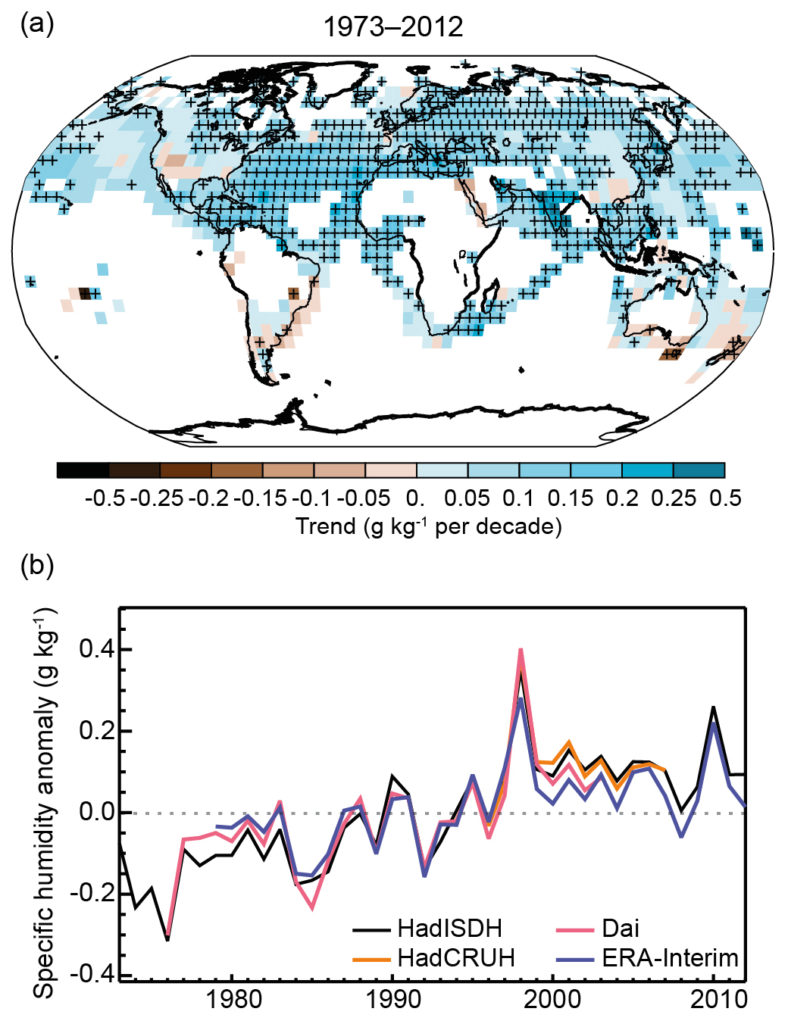
Numerous lines of evidence show that water vapor is increasing in the atmosphere. Surface specific humidity measurements, which have been made mostly in the Northern Hemisphere, show clear trends, as indicated in the figure below. Data from satellites indicate that precipitable water (the total amount of water that is in a column from the surface to the top of the atmosphere) increased 1.49% per decade from 1988 to 2017 (Mears et al., 2005). These trends are generally consistent with expectations of a warming world and the Clausius–Clapeyron equation. Variability from year to year is also consistent with temperature change. For example, the increases in temperature resulting from the very large 1997–1998 El Niño event were accompanied by large increases in surface specific humidity and total precipitable water.
There are trends and variations in many of the other trace gases as well, such as chlorofluorcarbons, which are decreasing in abundance due to emissions reductions. There are other trace gases that increase as the sun rises and decrease as it sets and are heavily involved in atmospheric chemistry. We will talk about these gases next.