
The Energy Out Sector
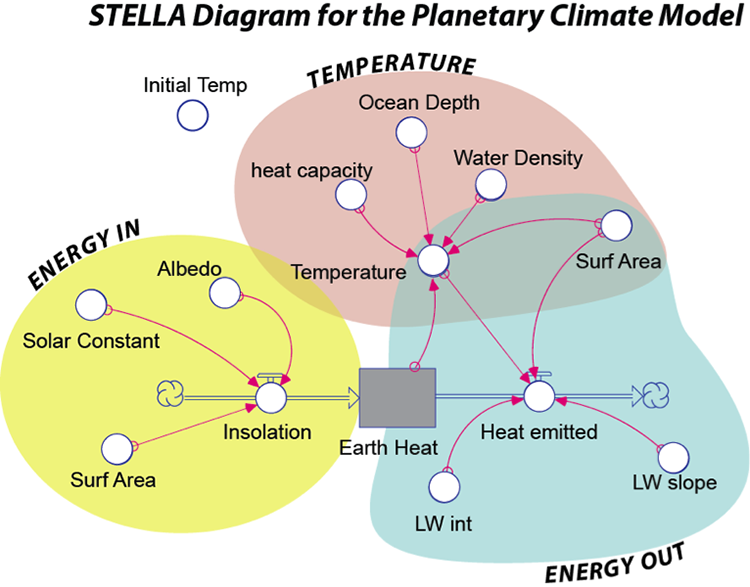
The Energy Out sector (blue above) of the model controls the amount of energy emitted by the Earth in the form of infrared (thermal) radiation, which is a form of electromagnetic radiation with a wavelength longer than visible light, but shorter than microwaves. You saw earlier that this is often described using the Stefan-Boltzmann Law which says that the energy emitted is equal to the surface area times the emissivity times the Stefan-Boltzmann constant times the temperature raised to the fourth power:
A is the whole surface area of the Earth (units are m2), ε is the emissivity (a number between 0 and 1 with no units), σ is the Stefan-Boltzmann constant (units are W/m2 per °K4), and T is the temperature of the Earth (in °K). The problem with this approach is that it ignores the greenhouse effect, which is a very important part of our climate system. We could represent the greenhouse effect by choosing the right value for the emissivity in the Stefan-Boltzman law, but here, we will use a different approach, one in which Eout is based on actual observations. With a satellite above the atmosphere, we can measure the amount of energy emitted in different places on Earth and figure out how it relates to the surface temperature. As it turns out, this is a pretty simple relationship, described by a line:
Eout=(〖LW〗_int+〖LW〗_s×T)×A
The part inside the parentheses is just the equation for a line, with an intercept (LWint with units of W/m2) and a slope (LWs with units of W/m2 per °C). This new way of describing Eout is shown as the red line in the figure below:
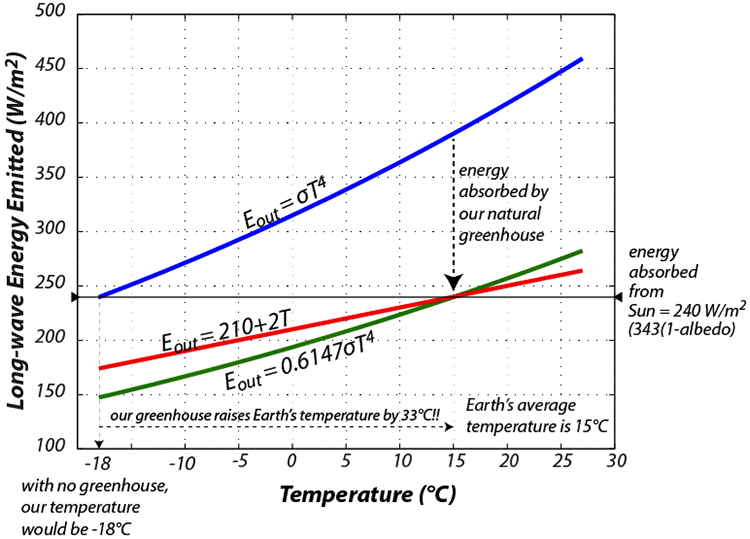
The key thing here is that the hotter something is, the more energy it gives off, which tends to cool it and it will continue to cool until the energy it gives off is equal to the energy it receives — this represents a negative feedback mechanism that tends to lead to a steady temperature, where Ein = Eout.