
The Global Capital Reservoir
In this model, Global Capital is a reservoir that represents all the goods and services of the global economic system; so this is much more than just money in the bank. This reservoir increases as a function of investments and decreases due to depreciation. Depreciation means that value is lost as things age and the model assumes a 10% depreciation per year; the 10% value comes from observations of rates of depreciation across the global economy in the past. The investment part is calculated as follows:
Investment = Savings Rate x (GDP - Abatement Costs – Climate Damages)
The savings rate is 18.5% per year (again based on observations). The GDP is the total economic output for each year, which depends on the global population, a productivity factor, and Global Capital.
Abatement Costs
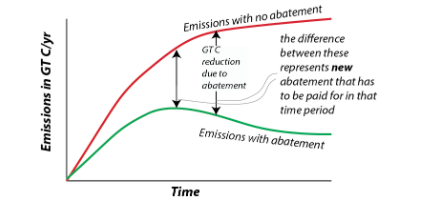
The Abatement Costs are the costs of reducing carbon emissions and are directly related to the amount by which we reduce carbon emissions. If we take steps to reduce our carbon emissions either by switching to renewable energy or improving efficiency or by direct removal of CO2 from the atmosphere, then there are costs associated with these steps. The model includes something called the abatement cost per GT C — this is the cost in trillions of dollars for each gigaton of carbon removed, and it can be changed over time. The default value is $3 trillion/GT C, which is a lot because it also includes the costs of large battery systems and new electrical transmission lines. But, the good thing about these costs is that once you pay for a GT of C removed, you don’t keep paying for it. If we were to completely cut all carbon emissions (currently around 10 GT C/yr) and do it in one year, it would cost $30 trillion or about 1/3 of the global GDP.
The diagram below shows how the abatement costs each year are figured out.
Climate Damages
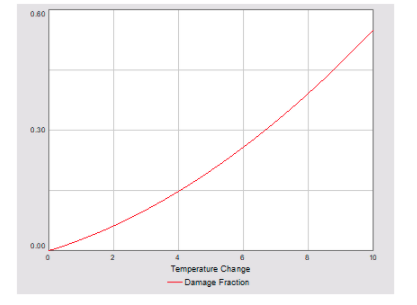
Climate Damages are the costs associated with rising global temperatures, including the costs of dealing with sea level change along coasts, extreme weather events (hurricanes, flooding, droughts, wildfires, etc.), labor (reduced productivity at higher temps), and increased human mortality (loss of workers hurts the economy). In the model, the climate damages are calculated as a fraction (think of this as a percentage) of the GDP. The fraction is a quadratic equation that looks like this:
damage fraction = slope × ΔT + coefficient × ΔTexponent
The ΔT is the global temperature change in °C. Both the slope and exponent can be adjusted in the model; the coefficient is set at 0.003. The default slope is 0.025 and the exponent is 2, which means that if we have a global temperature change of 4°C, damages equal to 15% of GDP; this rises to a devastating 55% for a temperature increase of 10°C. The diagram below shows what this damage fraction equation looks like, plotted as a function of temperature change in °C.
Relative Climate Costs
It will be useful to have a way of comparing the climate costs — the sum of the Abatement Costs and the Climate Damages — in a relative sense so that we see what the percentage of these costs is relative to the GDP of the economy. The model includes this relative measure of the climate costs (in trillions of dollars) as follows:
Relative Climate Costs = (Abatement Costs + Climate Damages) x GDP/initial GDP