Water Resource Availability
Introduction
The information presented here is intended to provide an overview of water resource availability including how water is used to maintain our quality of life, and how it is used for a variety of purposes including energy production, specifically for shale resource development. Water is obviously crucial to life and we rely on it for almost every aspect of our day to day activities, including for drinking, sanitation, industrial uses, irrigation for crops, food production, recreation, and power development. Water also sustains our environment by providing flow to our streams and rivers. The graphic below summarizes how much water is used in Pennsylvania for a variety of these applications. As this graphic shows, the combined amount of water used for domestic and public water supply (about 1.57 billion gallons per day) is more than 100 times greater than the amount of water used for hydraulic fracturing (estimated to be 14.8 million gallons per day) on a daily basis in Pennsylvania.
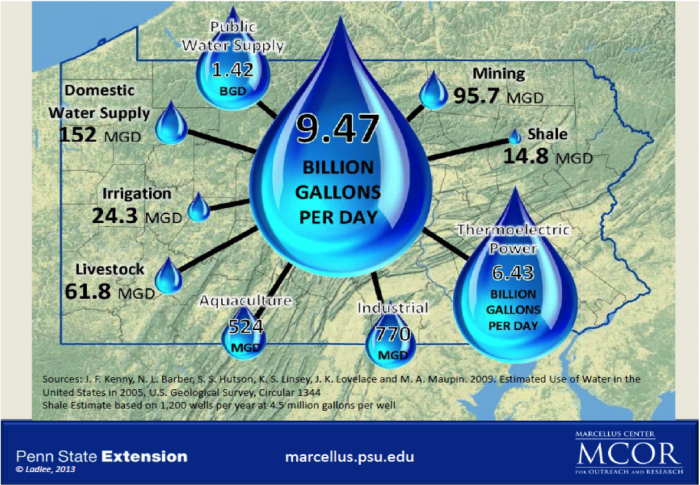
- Thermoelectric Power: 6.43 billion gallons per day
- Public Water Supply: 1.42 BGD
- Industrial: 770 MGD
- Aquaculture: 524 MGD
- Domestic Water Supply: 152 MGD
- Mining: 95.7 MGD
- Livestock: 61.8 MGD
- Irrigation: 24.3 MGD
- Shale: 14.8 MGD
Check Your Understanding
Required Reading
This US Geological Survey Publication, Summary of estimated water use in the United States in 2015, provides very interesting water use statistics. Please review the report to get a sense of water use for various activities for the state that you live in.
The amount of water contained on earth is finite with about 333 million cubic miles of water, of which only 2.4% is fresh and 97.5 saline; its occurrence is controlled by the hydrologic cycle as shown below.
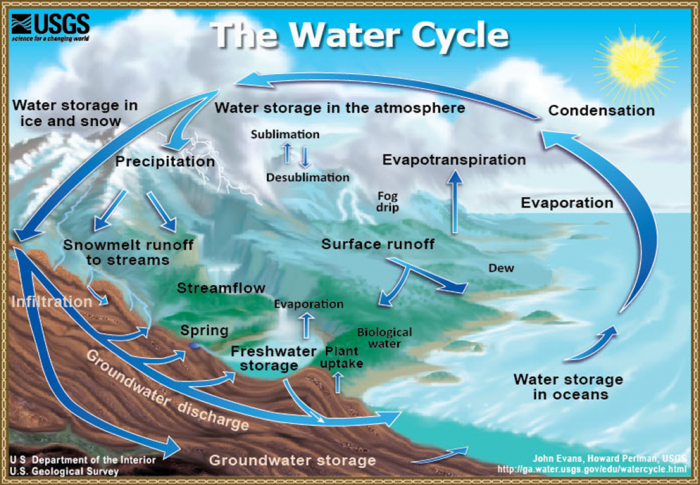
- Water storage in oceans
- Evaporation: The process by which water is changed from liquid to gas or vapor
- Sublimation: The changing of snow or ice to water vapor without melting
- Evapotranspiration: The process by which water vapor is discharged to the atmosphere as a result of evaporation from the soil transpiration (realse of water from plant leaves) by plants
- Water storage in the atmosphere: Water stored in the atmosphere as vapor, such as clouds and humidity
- Condensation: The process by which water is changed from vapor to liquid
- Precipitation: The discharge of water, in liquid or solid state, out of the atmosphere, generally upon a land or water surface
- Water storage in ice and snow: Freshwater stored in frozen form, generally in glaciers, ice fields, and snowfields
- Snowmelt runoff to streams: The movement of water as surface runoff from snow and ice to surface water
- Surface runoff: Precipitation runoff which travels over the soil surface to the nearest stream channel
- Streamflow: The movement of water in a natural channel, such as a river
- Lakes and rivers: Freshwater existing on the Earth's surface
- Infiltration: The downward movement of water from the land surface into soil or porous rock
- Groundwater storage: Water existing for long periods below the Earth's surface
- Groundwater flow and discharge: The movement of water out of the ground
- Spring: A place where a concentrated discharge of groundwater flows at the ground surface
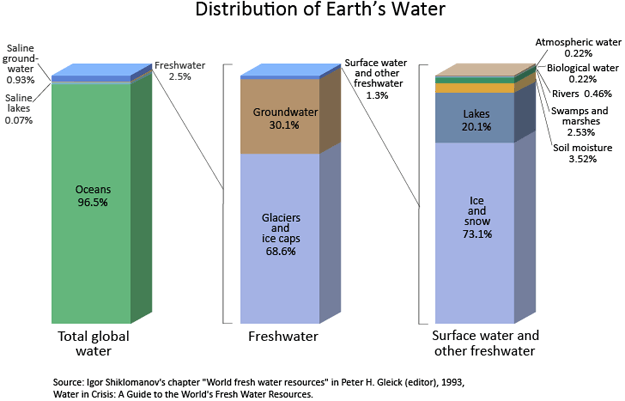
Water covers nearly 71% of the Earth’s surface: 96.5% of the planet's water is found in oceans, 1.7% in groundwater, 1.7% in glaciers and the ice caps, and 0.1% in clouds or precipitation as illustrated below. Furthermore, of all of the water on earth--about 97.5%--is considered to be unusable; that is, not potable for drinking water purposes. Greater than two-thirds of the fresh water on the earth is stored in glaciers and ices caps, with groundwater and surface water representing the other third of freshwater resources. The vast majority of fresh water is frozen in glaciers and ice caps (68.6%) and therefore unavailable for use. The available freshwater comes to us mainly as groundwater (comprising 99% of available fresh water) along with some surface water (1% of fresh water), collectively comprising 30.4% of freshwater resources.