
Population Growth vs. Water Needs
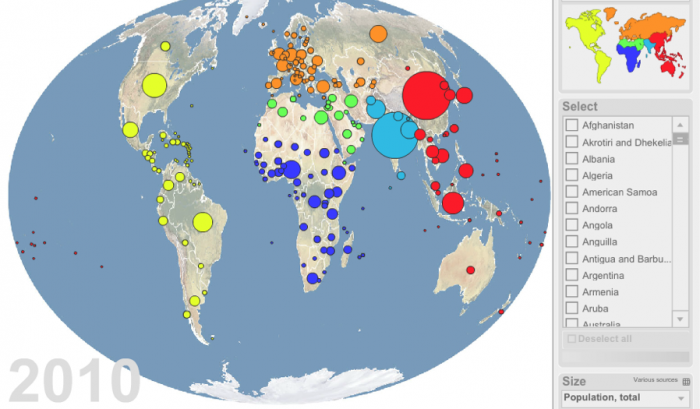
Do we have excess capacity to supply this water? That is an important question, but you have probably already determined that the real issue is where the population growth occurs and what water resources are available there. The major growth is projected to occur in developing countries (Figure 17). African nations are likely regions for greater than average growth. Interestingly, much of Africa is estimated to have significant groundwater resources (BGS, 2013) that could be developed if necessary. In fact, Nigeria is projected to surpass the population of the U.S. by 2050 (Figures 17-19). One must examine the population density and rate of projected growth vs. water needs. In addition, climate change impacts must be considered.
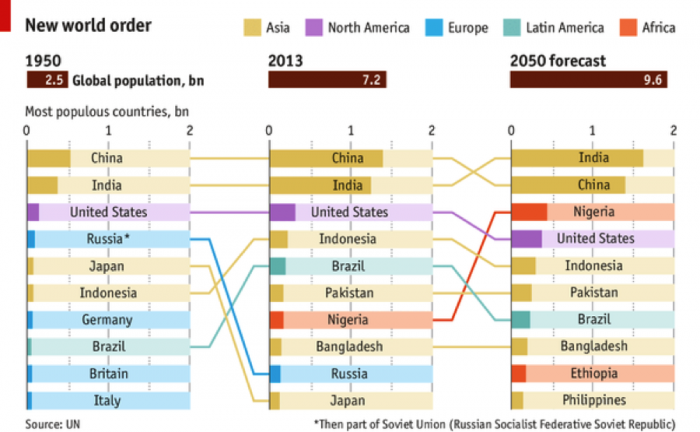
Click link to expand for a text description of Figure 18
1950- total population 2.5 bn
- China- .5 billion
- India
- United States
- Russia
- Japan
- Indonesia
- Germany
- Brazil
- Britain
- Italy
2013- total population 7.2 bn
- China-4 bn
- India
- United States
- Indonesia
- Brazil
- Pakistan
- Nigeria
- Bangladesh
- Russia
- Japan
2050 forecast- total population 9.6 bn
- India-7 bn
- China
- Nigeria
- United States
- Indonesia
- Pakistan
- Brazil
- Bangladesh
- Ethiopia
- Philippines
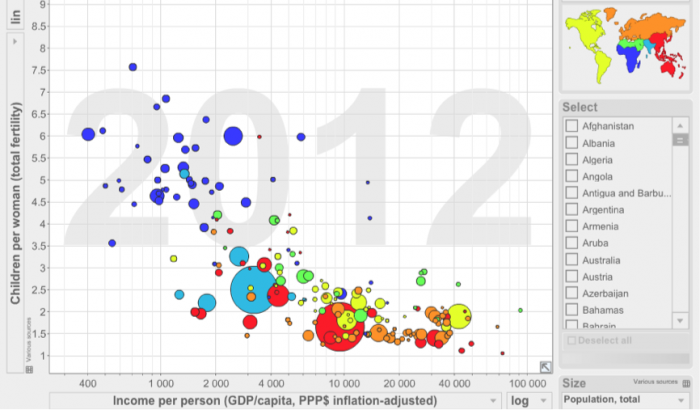
Click the link to expand for a text description of Figure 19
Learning Checkpoint
1. What is the relationship between Total Fertility and Per Capita Income shown in Figure 19 above?
ANSWER: Fertility is inversely related to income worldwide. There are several drivers of this relationship, including infant mortality, need for agrarian labor, etc.
2. Why might this be an important consideration when considering future demand for water?
ANSWER: The greatest growth is likely to occur in areas with the least access to infrastructure for accessing, treating, and distributing fresh water.