
The Water and Energy Nexus
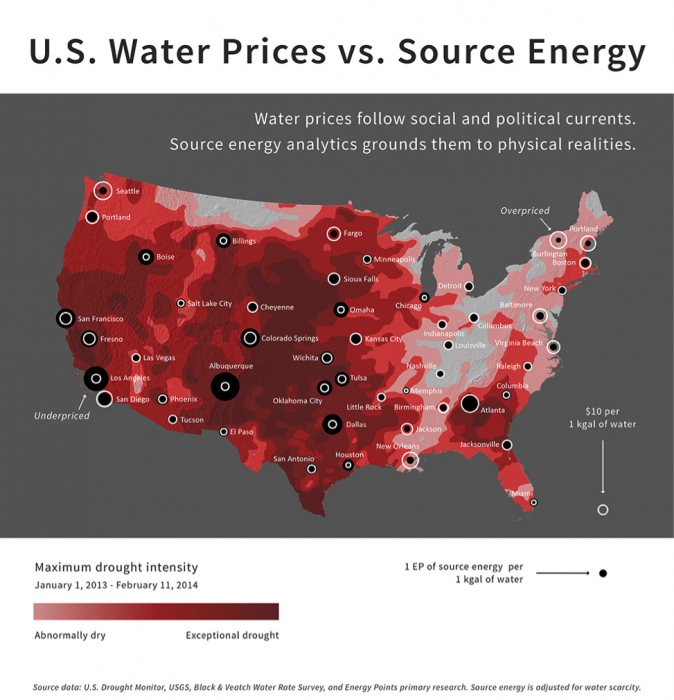
Considerations of water pricing are complicated because of the multitude of factors that must be taken into account. These include availability and dependability of water supply locally, state of the distribution infrastructure, and the distribution and size of the user base. Dependability is related to climate impacts, such as prolonged droughts that deplete water reserves. A recent study (Watergy Nexus: The Complex Relationship and Looming Crisis Between Our Thirst For Water and Our Hunger for Energy) highlights an additional factor—the amount and cost of energy to acquire, transport, and treat water. This study argues that the cost of energy (usually electricity, but including fuel if the water is trucked in) must be considered in pricing water. The study uses data for 2013, a year of severe drought in much of the western and central U.S. to show how water prices should be adjusted to guarantee supply and cover costs of acquisition. Although the U.S. Geological Survey indicates that the average energy required to provide 1000 gallons (1 kgal) of water is 1.9kWh of electricity, water-stressed regions such as northern California (3.5 kWh/kgal) and highly stressed southern California (11.1 kWh/kgal) require far more (Figure 24). However, the study suggests that municipalities are not taking this factor into consideration in providing a durable and resilient water supply. During times of water stress, municipalities may have trouble meeting costs, and begin to examine other strategies, such as privatization. Of course, when water availability becomes restricted, costs can go up as in California with severe drought conditions (e.g., see the news article In dry California, water fetching record prices about California water pricing: ).
Click for a text description
Learning Checkpoint
1. What factors drive water pricing?
ANSWER: Factors that must be considered include: the availability and dependability of water supply locally, state of the distribution infrastructure and potential costs needed to improve or maintain it, cost of delivery – including energy, distribution, and size of the user base, and demand.