
Pricing Varies
You are likely all too familiar with bottled water—that convenient liter-sized plastic bottle containing some sort of water, commonly tap water, or filtered spring water, sometimes treated…it appears that, in the U.S., we pay for the convenience of "grab-and-go." For that convenience, we typically pay about $4/gallon, more than we presently pay for a gallon of gasoline! In most municipalities; however, the cost of water delivered in pipes to taps in homes costs far less ($0.003-0.006/gallon). A survey by CircleofBlue.org for 2014 water pricing in 30 cities across the U.S. found an average increase of 6.2% in monthly bills for a family of four using an average of 100 gals/day each (12,000 gals/mo or 45.4 m3/mo) from 2013 to 2014.
Monthly rates for some representative municipalities are shown in the table below, based on data in the CircleofBlue.org survey and information from water authority websites for some municipalities not covered in that survey (Pittsburgh, PA and State College, PA). Note the large range in rates that do not seem to make sense geographically. For example, arid Phoenix, AZ has the lowest rate, with Las Vegas, NV not far behind, whereas high precipitation, seemingly water-rich regions such as Seattle, WA and Atlanta, GA top the rate list. Note that Los Angeles, CA, Phoenix, AZ, and Las Vegas, NV all depend on Colorado River water, although Los Angeles also draws on northern California sources and all require significant transport infrastructure. So, in part, this disparity in rates results from the costs of maintaining infrastructure and the numbers of households served, as well as the local abundance of water.
| Municipality (city, state) | Monthly rate (12,000 gals) | Percentage change (2014-2013) |
|---|---|---|
| Phoenix, AZ | $38.75 | 0 |
| Chicago, IL | $39.72 | +14.9 |
| Las Vegas, NV | $42.27 | +2.8 |
| State College, PA | $47.40 | 0 |
| New York, NY | $57.28 | +5.6 |
| Philadelphia, PA | $65.88 | +5.0 |
| Los Angeles, CA | $75.98 | +14.5 |
| Atlanta, GA | $91.92 | 0 |
| Seattle, WA | $98.77 | +9.3 |
| Pittsburgh, PA | $100.81 | ? |
Chicago, IL, for example, has nearby Lake Michigan as a source and a large number of users and its rates are relatively low. Little State College, PA has a significant, sustainable groundwater resource (see Module 6), even though the user base is relatively small. Many municipalities have higher rates because they are financing necessary improvements in infrastructure, which can be quite costly.
Municipalities have adopted different methods for scaling water prices. Some, such as Philadelphia and Detroit, provide cost reductions for larger users (decreasing block), some, including New York, have uniform pricing, whereas others, such as Las Vegas and Atlanta, have implemented tiered pricing (block increases) that encourage conservation while trying to maintain the user base. The objective of all municipalities is to sustain income and provide for future infrastructure requirements.
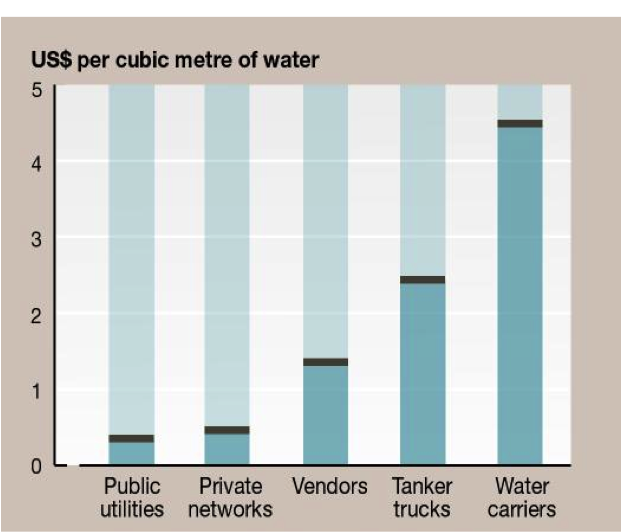
Internationally, pricing varies even more than in the U.S. Figure 22 illustrates average water prices (Kariuki and Schwartz, 2005) and the impact of non-public water suppliers on the cost to the consumer. Where public utilities are not available, the cost to the consumer can be a factor of 10 higher. In part, this occurs because of increases in cost to the water supplier to purchase water from a public or private supplier because of the large volumes purchased with prevailing block pricing increases. Figure 23 shows the step increases for several African and Indian cities. Recall that the average family of four in the U.S. would use about 45 m3/month, but average usage is probably much lower in many developing nations with lower standards of living. Step increases in block pricing appear to be a fair method of pricing to allow low cost for low-volume users and encouraging conservation by imposing higher costs for larger-volume users.
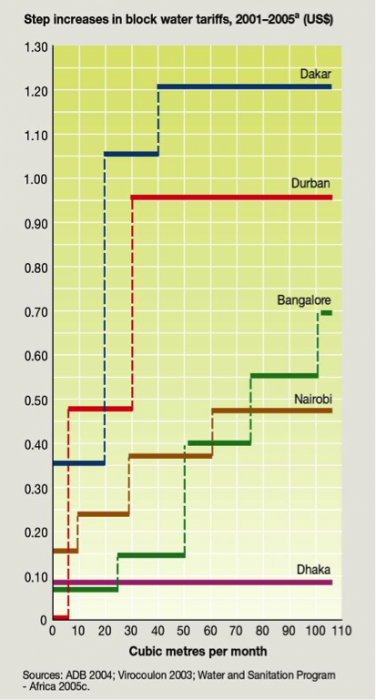
Click the link to expand for a text description of Figure 23