Figure 0.29: The Fossil Record of Marine Animal Biodiversity
Click for a text description of Figure 0.29.
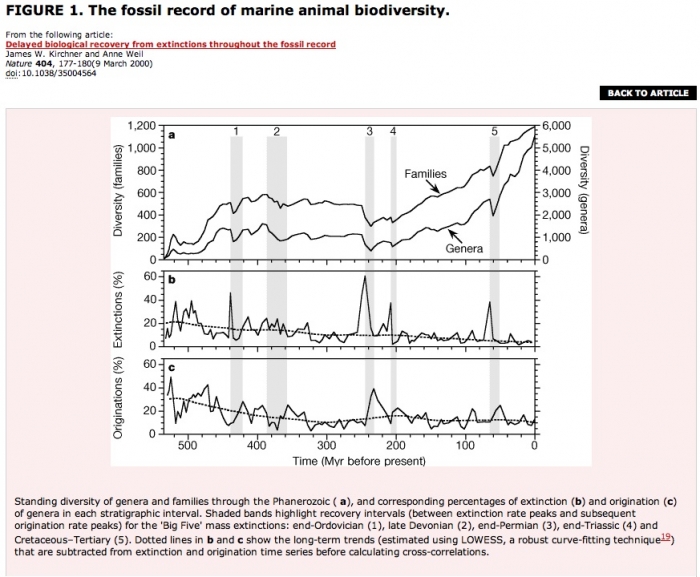
Standing diversity of genera and families through the Phanerozoic (a), and corresponding percentages of extinction (b) and origination (c) of genera in each stratigraphic interval. Shaded bands highlight recovery intervals (between extinction rate peaks and subsequent origination rate peaks) for the 'Big Five' mass extinctions: end-Ordovician (1), late Devonian (2), end-Permian (3), end-Triassic (4) and Cretaceous-Tertiary (5). Dotted lines in b and c show the long-term trends (estimated using LOWESS, a robust curve-fitting technique) that are subtracted from extinction and origination time series before calculating cross-correlations.
Credit: