Syntax Introduced: scale()
You can use the function scale() to zoom the coordinate system. It can can take either one argument, or else two arguments if you want to zoom the x and y coordinates differently. In the example below, pay attention to the fact that it's the coordinates that are being stretched, not the shapes. In effect, this means that the position of the shape will change as well as its size.
Example 5.8
size(200, 200);

ellipse(20, 20, 10, 10);

pushMatrix();
scale(1.5); // Zoom axes by 1.5X
ellipse(20, 20, 10, 10);

scale(1.5); // Scale is cumulative, so now things will be stretched by 2.25X
ellipse(20, 20, 10, 10);
popMatrix();

// The ellipse below is the same size as the one inside the push/pop
// pair that had been stretched by 2.25X
ellipse(70, 70, 22.5, 22.5);

scale(1.5, 1); // Only scaling x
ellipse(70, 70, 10, 10);
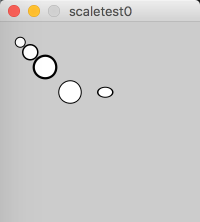
Output of Example 5.8. Circles plotted with some scaling changes.
E. Richardson
In the program in Example 5.8, when the coordinate system got stretched, the strokeWeight got thicker, too. The strokeWeight is also affected by scale(). If you don’t want this to happen, you can get around it by dividing the strokeWeight by the scale factor, like this:
Example 5.9
// Demonstrate the uses of scale
// Fix the strokeWeight

size(200, 200);
float s = 1.5;
ellipse(20, 20, 10, 10);
scale(s); // Makes things 150% bigger
strokeWeight(1/s); // Divide by scale
ellipse(30, 30, 10, 10);
scale(s); // Scale is cumulative
strokeWeight(1/(2*s)); // Divide by the total scale
ellipse(40, 40, 10, 10);
scale(s, 1); // Only scaling x
strokeWeight(1/(3*s));
ellipse(50, 50, 10, 10);
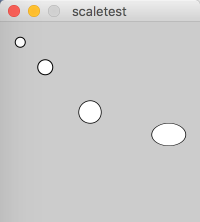
Demonstration of scale() with the strokeWeight fixed.
E. Richardson