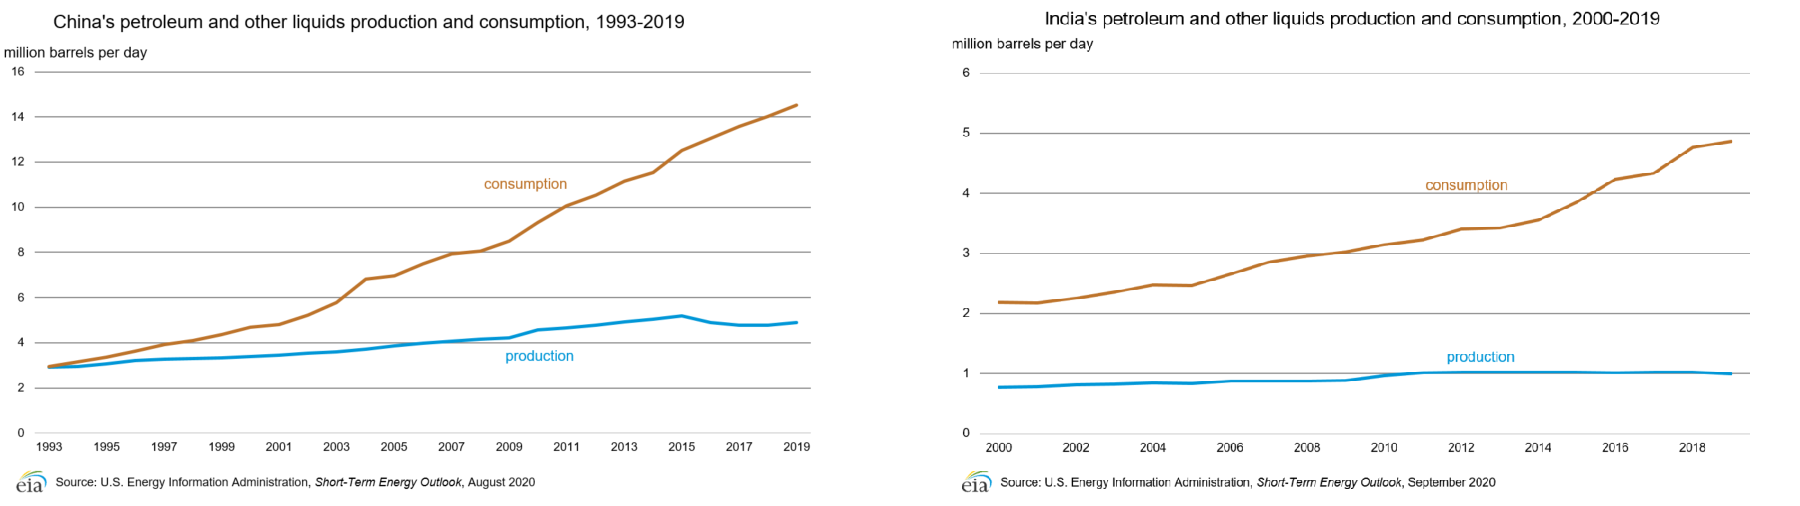
Economists have long recognized that we are truly a global society and all of our economies are intrinsically tied together. Growth or recession in one region of the world could have a ripple effect on other regions. China and India were emerging as large-scale industrial countries with vast exports of manufactured goods. Both were consuming new, higher levels of energy (Figure 4), and most specifically, crude oil. News of increasing crude imports by both countries sparked buying of the financial commodity contracts.
The so-called “speculators” were blamed for a lot of the price increase that year, but there was a whole new set of players who greatly influenced the market. Investment funds and private investors, both domestic and international, saw the crude market as a “safe harbor” from the ups-and-downs of the stock market and the US dollar. When the stock market fell, they bought crude oil contracts. And when it rose, they sold those same contracts. The dollar is a little more complicated. When the value of the US dollar falls relative to foreign currency, overseas investors have more “buying power,” that is, they can buy more crude with their currency than those holding US dollars. So, to some extent, it is true that “traders” had a major influence on oil prices that year. But the definition of “trader” had changed from the stereotypical “day trader,” who wreaks havoc on markets, to sophisticated investors and real demand from emerging nations.
Today, the economic health of various countries still impacts the volatility in oil prices, and the US dollar and crude prices have a very high but inverse correlation. And geopolitical conflicts involving oil-producing countries and regions always cause concern over potential supply disruptions.
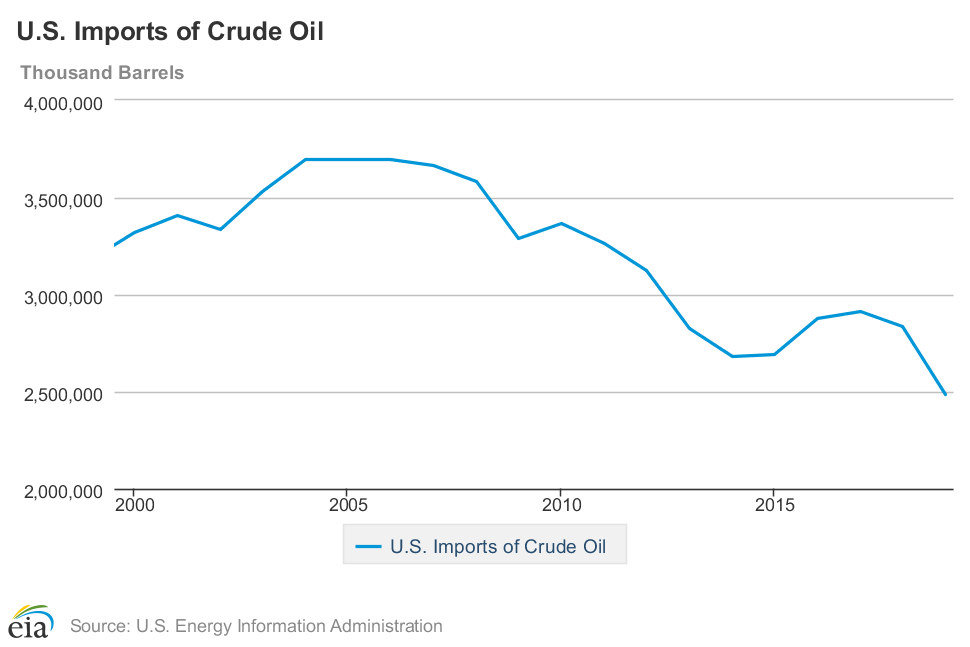
US oil production has been risen over the past years (before the unprecedented situation in 2020) and stayed at about 12.8 million barrels per day in December 2019. This represents an increase from 2008 to early 2015, decrease in production from around mid 2015 to September 2016, and then increase in production again from then to late 2019. Production from 2014 to 2018 has been over 8.0 million Bbl/d. In 2016, U.S. crude oil production represents only about 55% of consumption, with the remainder coming in the form of imports. However, as Figure 3 shows, imports continue to decline as domestic crude supplies increase.
The rise in domestic oil production is mostly attributed to the new, “unconventional”, sources found in shale formations and high levels of oil price make the production from these sources more profitable. Advances in seismology (“3-D”), directional drilling (“horizontal”) and, fracturing methods (“fracking”), have made this once inaccessible resource commonplace today. Contrary to some beliefs, the number one source of imported crude oil in the US is not the Middle East, but Canada. Oil from tar sands in their Western Provinces is shipped via pipeline into the US.
Figure 2 is extracted from the EIA report on the U.S. crude oil production. Figure 2 shows the upward trend in oil production over the (6) years before 2015, downward trend from mid 2015 to late 2016, and upward production trend again from late 2016 to late 2019 (before the unprecedented global pandemic in 2020). (Based on the latest completed study by the Energy Information Agency of the US Department of Energy.) This link from the EIA includes the historical data from the 20th century.
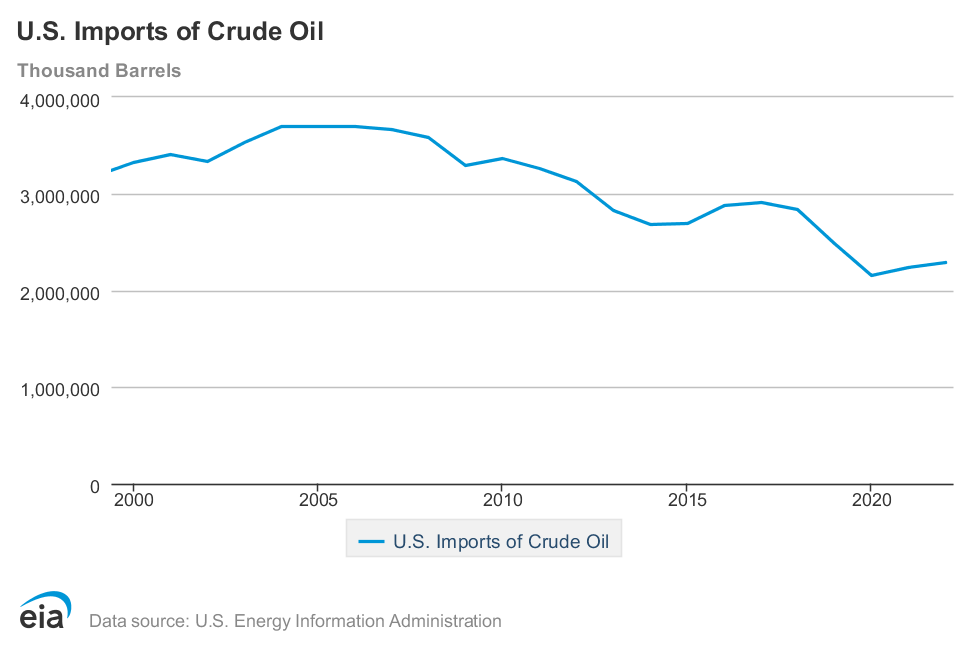
Figure 3 shows the downward trend in oil imports for the same time period (2000 - 2020).
Crude oil is produced in 32 states in the United States and as of 2021 about 71% of domestic crude oil production comes from the following five states:
- Texas: 42.4%
- New Mexico: 11.1%
- North Dakota 9.9%
- Alaska: 3.9%
- Colorado: 3.7%
Crude oil is produced in about 100 countries around the world. In 2021 about half of the world oil production comes from the following five countries:
- United States: 14.5%
- Russia: 13.1%
- Saudi Arabia: 12.1%
- Iraq: 5.3%
- Canada: 5.8%
Here are the top five oil consumer countries in the world in 2021:
- United States: 21%
- China: 15%
- India: 5%
- Russia: 4%
- Japan: 4%
According to EIA:
" In 2022, the United States imported about 8.32 million barrels per day (b/d) of petroleum from 80 countries. Petroleum includes crude oil, hydrocarbon gas liquids (HGLs), refined petroleum products such as gasoline and diesel fuel, and biofuels. Crude oil imports of about 6.28 million b/d accounted for about 75% of U.S. total gross petroleum imports, and non-crude oil petroleum accounted for about 25% of U.S. total gross petroleum imports. ”
Here are the top five countries that the US is importing oil from with their share in 2022:
- Canada: 4.4 million barrels per day (52%)
- Mexico: 0.81 million barrels per day (10%)
- Saudi Arabia: 0.56 million barrels per day (7%)
- Iraq: 0.31 million barrels per day (4%)
- Columbia: 0.24 million barrels per day (3%)
Figure 4 displays the China and India oil production and consumption since the 90s. As you can see in this graph, oil consumption by these two countries has increased substantially during the past two decades, while their oil production hasn't changed significantly. This gap has created a large oil demand from these two counties in the global oil market.