Extracted natural gas is mainly composed of methane, with small amounts of hydrocarbon gas liquids (HGL) and nonhydrocarbon gases. After natural gas is produced, it has to be processed and impurities have to be removed to meet the pipeline standards and become marketable. The infrastructure of natural gas delivery (before distribution) can be divided into three main categories:
- Processing: removing and separating other hydrocarbons, contaminants, and impurities.
- Transportation: transporting the processed natural gas with the pipeline.
- Storage: storing natural gas in underground storage sites (depleted natural gas or oil fields, salt caverns, and aquifers) for high-demand periods.
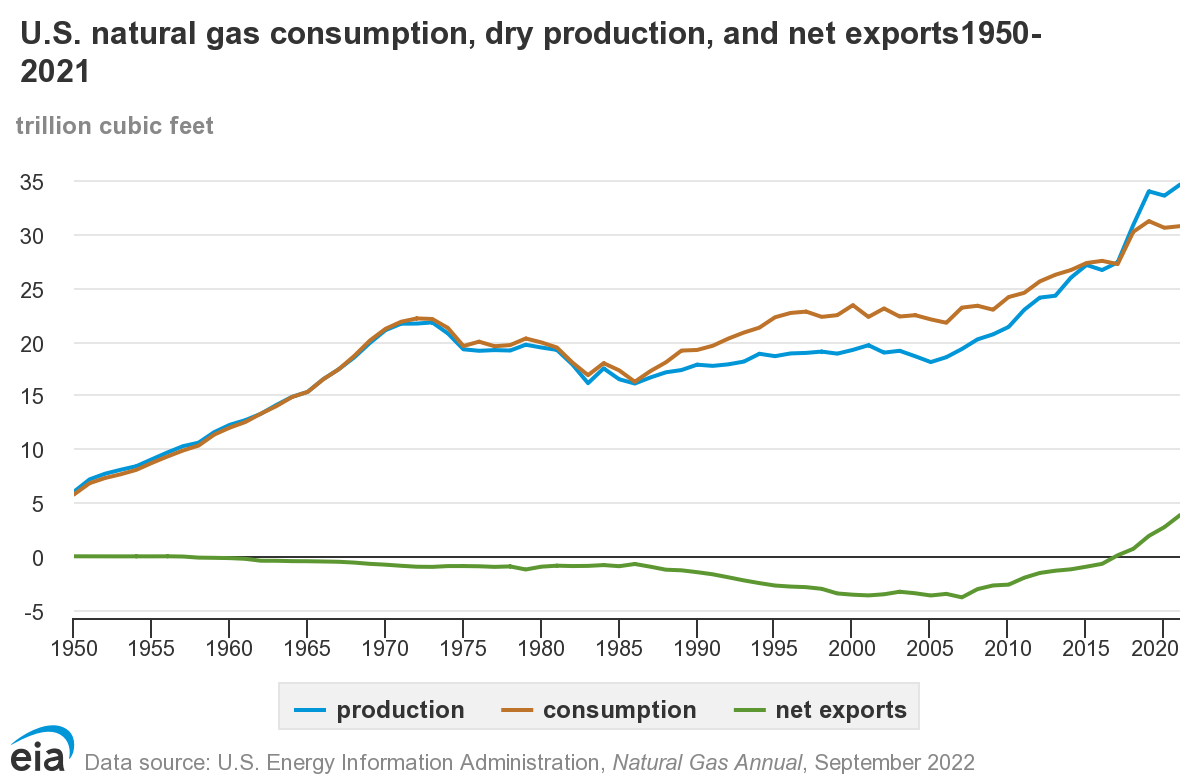
In 2021, U.S. dry natural gas production was about 34.5 trillion cubic feet and about 13% more than total U.S. gas consumption. This year, five states produced about 69% of total U.S. dry natural gas:
- Texas: 24.6%
- Pennsylvania: 21.8%
- Louisiana: 9.9%
- West Virginia: 7.4%
- Oklahoma: 6.7%
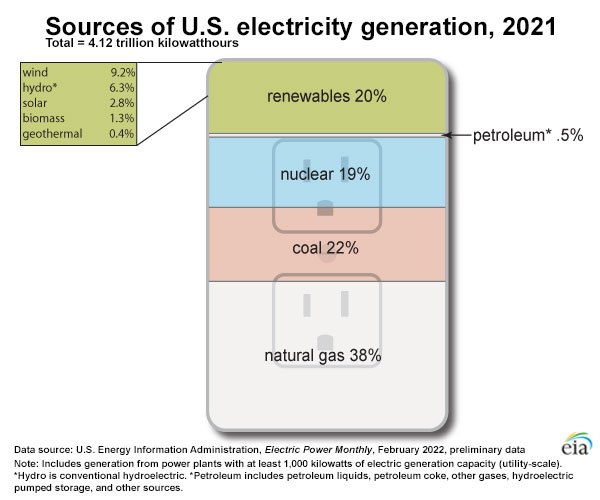
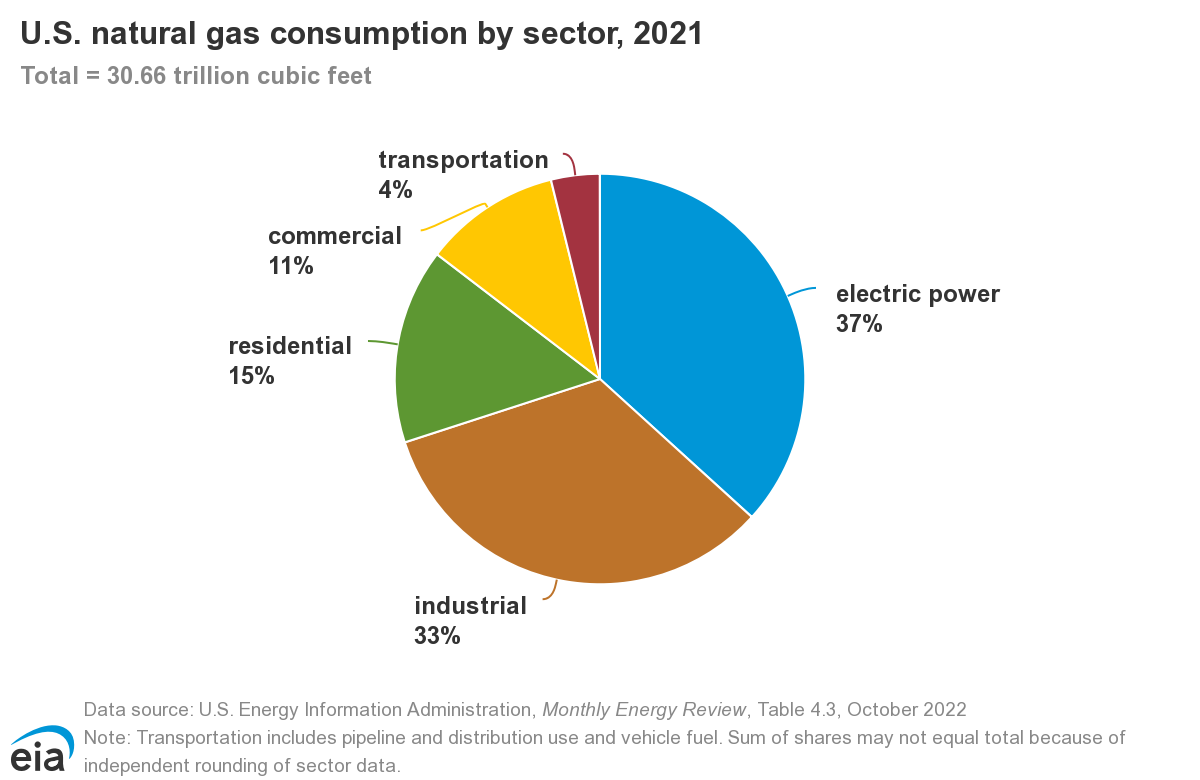
Natural gas is used in more than 50% of US homes for space heating and hot water. In addition, it is the largest source of energy for electrical generation at the moment (2021), see Figure 5. Natural Gas is also widely used in industrial, commercial, and industrial sectors. Figure 6 illustrates the breakdown of natural gas consumption by sector.
Click to expand to provide more information
| Energy source | Share of total |
|---|---|
| Natural gas | 38% |
| Coal | 23% |
| Nuclear | 20% |
| Renewables (total) | 17% |
| Hydropower | 6.6% |
| Wind | 7.3% |
| Solar | 1.8% |
| Biomass | 1.4% |
| Geothermal | 0.4% |
Click to expand to provide more information
| Energy Sector | Share of total |
|---|---|
| Electric Power | 36% |
| Industrial | 33% |
| Residential | 16% |
| Commercial | 11% |
| Transportation | 3% |
Domestic production in the US (see Figure 7) has grown dramatically in recent years due to the same advanced technologies that have allowed crude oil production to increase: “3-D” seismology, horizontal drilling and new “fracking” methods. All contribute to successful recoveries from hard formations such as the new “shales.”
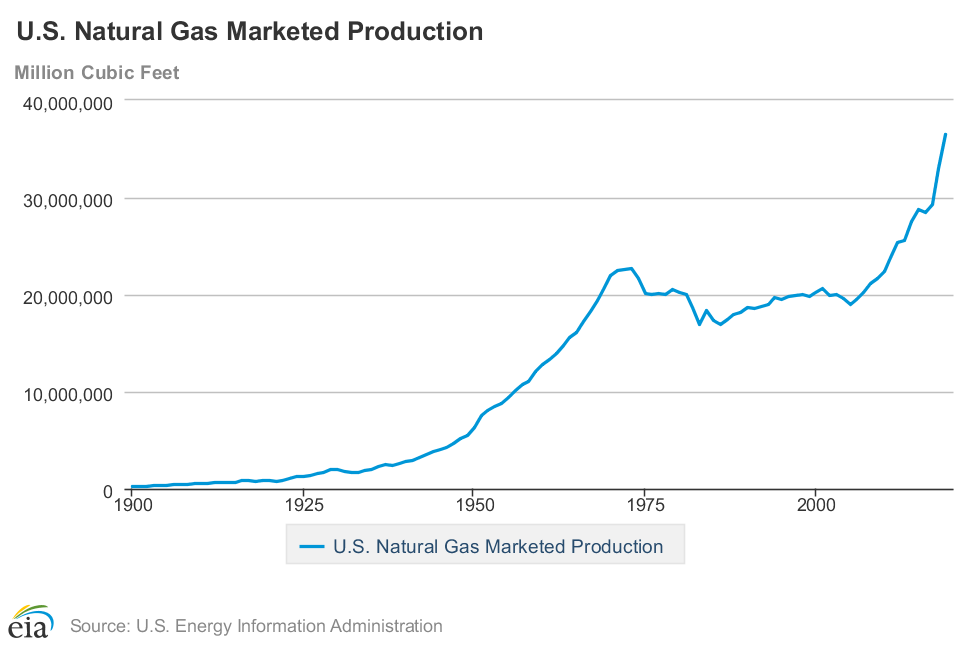
Click for a text alternative to Figure 7
| Decade | Natural Gas Production |
|---|---|
| 1900 | 1028,000 |
| 1910 | 509,000 |
| 1920 | 812,000 |
| 1930 | 1,978,911 |
| 1940 | 2,733,819 |
| 1950 | 6,282,060 |
| 1960 | 12,771,038 |
| 1970 | 21,920,642 |
| 1980 | 20,179,724 |
| 1990 | 18,593,792 |
| 2000 | 20,197,511 |
| 2010 | 22,381,873 |
| 2019 | 36,515,188 |
Figure 8 illustrates the growth in the production of the currently active shale basins in the US. As you can see in the graph, natural gas production from Marcellus Shale formations, located mostly in Pennsylvania, West Virginia, Ohio, and New York, has been increasing during the past decade and has the largest portion of gas production among the shale formations.
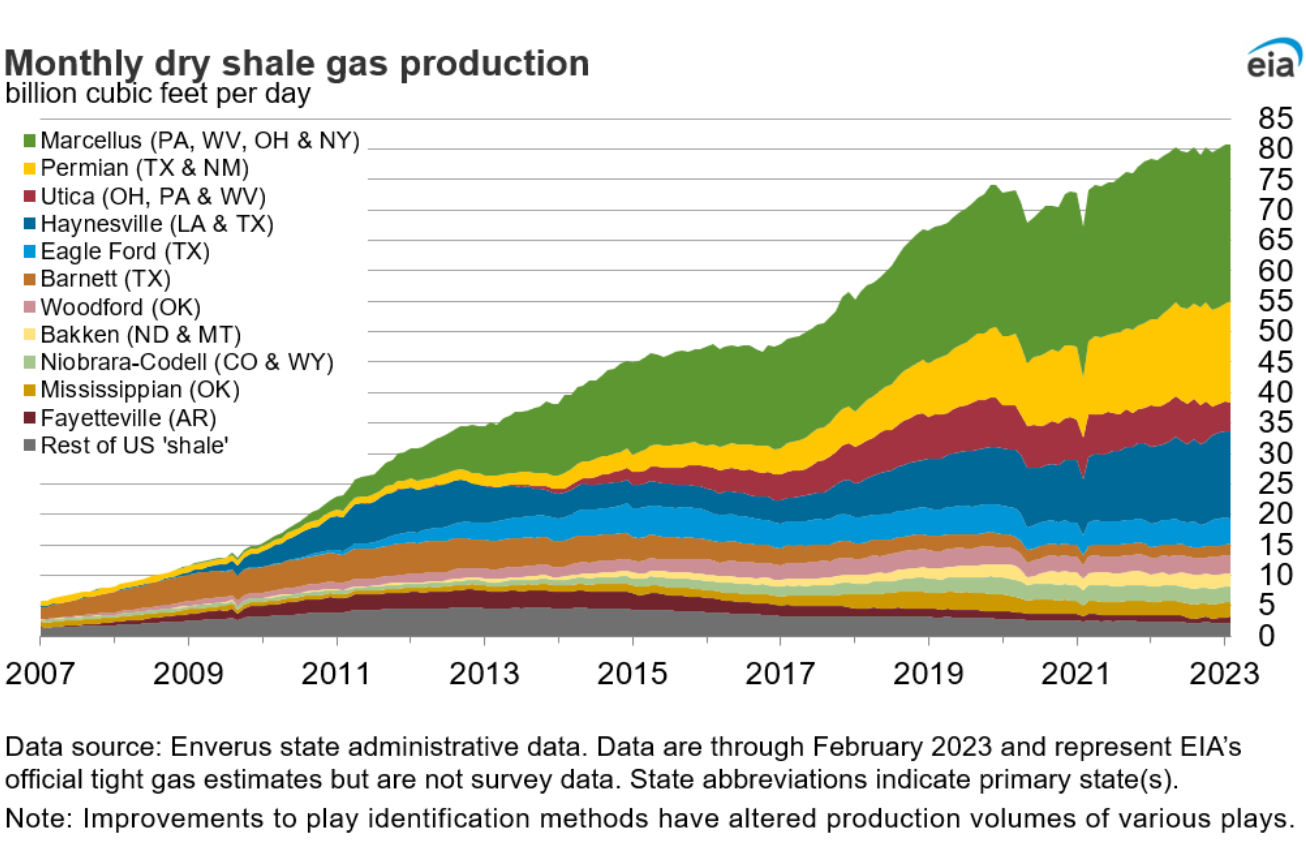
Production Growth of Active U.S. Shale Basins
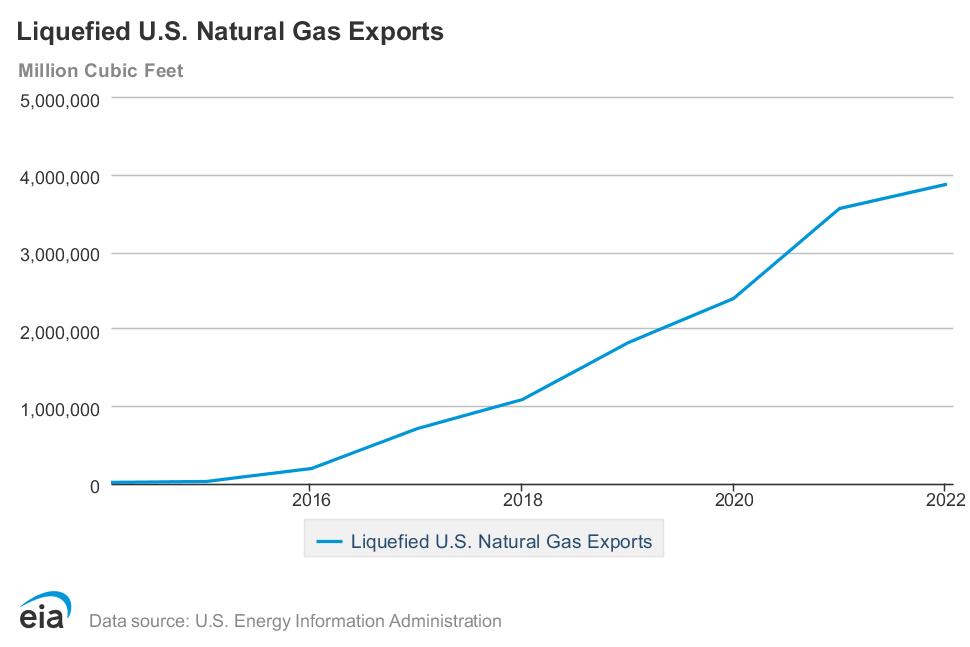
Due to the increasing demand since the late 1980s, the US also imports natural gas (see Figure 9). Canada represents the largest source (more than 97%) of imported natural gas, with Mexico contributing a minor amount. The export of natural gas had been very limited through pipeline export points into Canada and Mexico. However, the export changed dramatically since 2016 due to the skyrocketing LNG export. In 2017, the U.S. became a net exporter of natural gas and in 2021, the LNG export exceeded pipeline export for the first time since 1990.