6.1 Ethanol Production - General Information
Back in Lesson 2, I included a chemistry tutorial on some of the basic constituents of fuels. In this lesson, we will be discussing the production of ethanol (CH3-CH2-OH) and butanol (CH3-CH2-CH2-CH2-OH) from starch and sugar. Ethanol, or ethyl alcohol, is a chemical that is volatile, colorless, and flammable. It can be produced from petroleum via the chemical transformation of ethylene, but it can also be produced by fermentation of glucose, using yeast or other microorganisms; current fuel ethanol plants make ethanol via fermentation.
The basic formula for making ethanol from sugar glucose is as follows:
For fermentation, yeast is needed (other enzymes are used but yeast is most common), a sugar such as glucose is the carbon source, and anaerobic conditions (without oxygen) must be present. If you have aerobic (with oxygen) conditions, the sugar will be completely converted into CO2 with little ethanol produced. Other nutrients include water, a nitrogen source, and micronutrients.
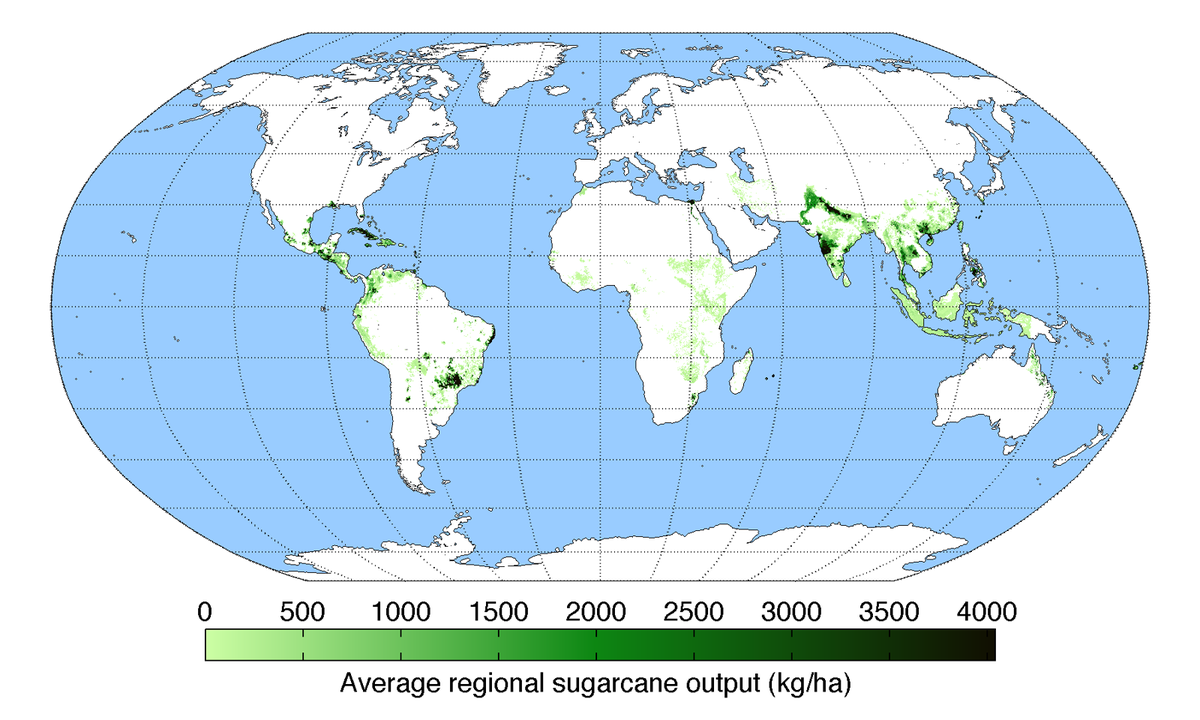
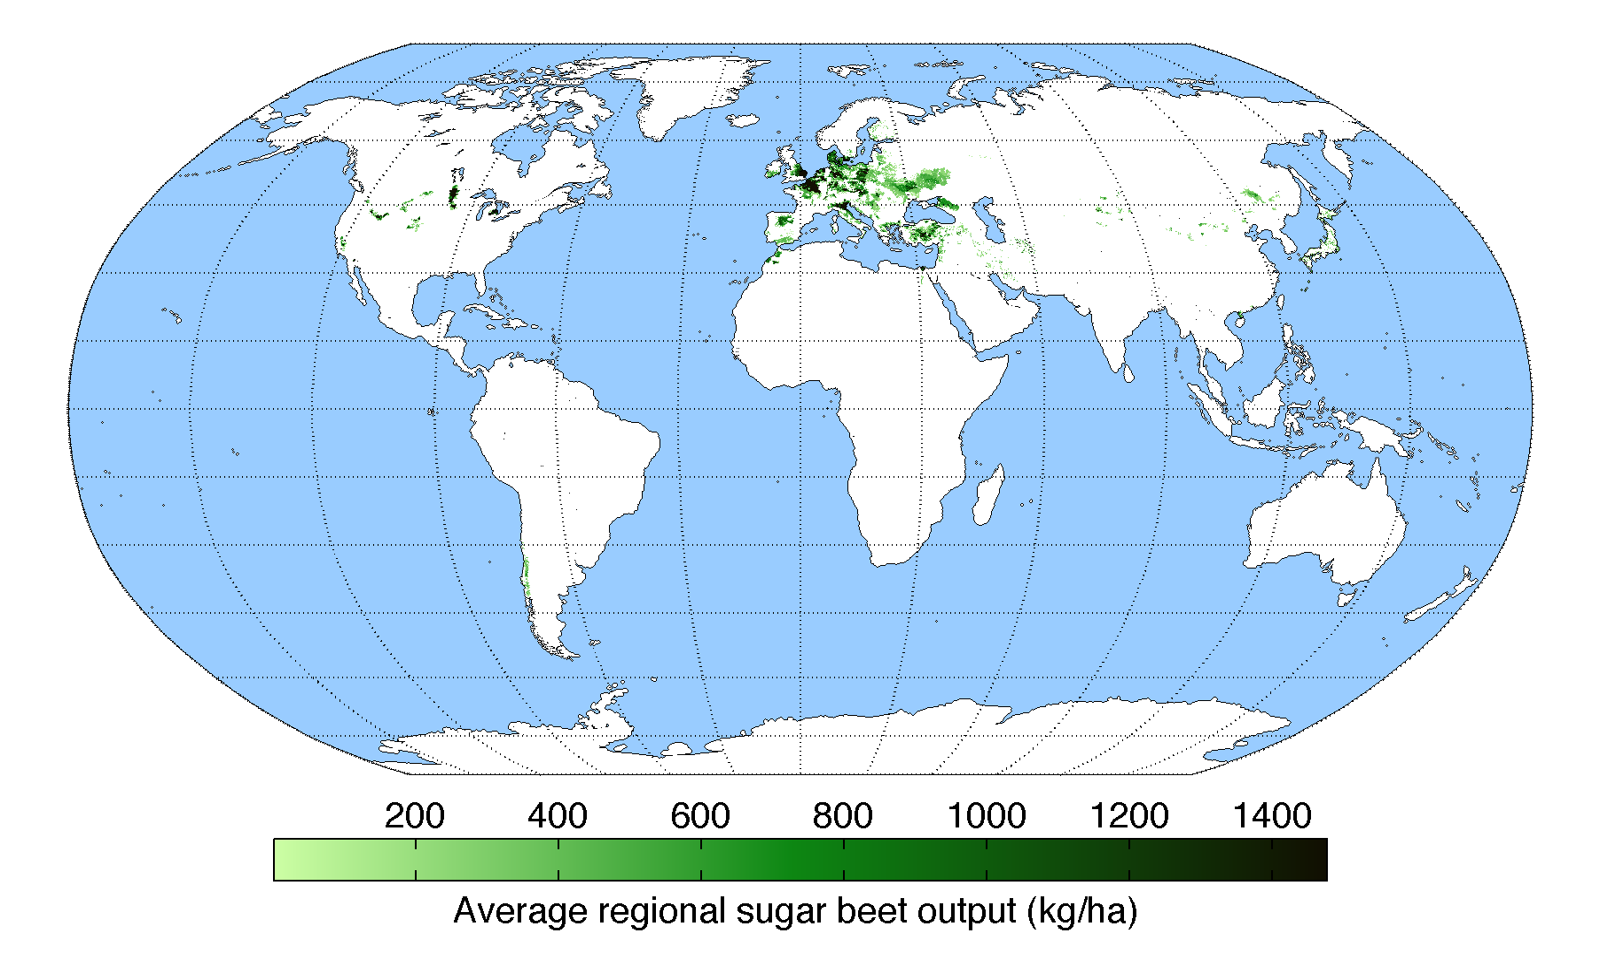
Here in the US, the current common method of ethanol fuel production comes from starches, such as corn, wheat, and potatoes. The starch is hydrolyzed into glucose before proceeding with the rest of the process. In Brazil, sucrose, or sugar in sugarcane is the most common feedstock. And in Europe, the most common feed is sugar beets. Cellulose is being used in developing methods, which include wood, grasses, and crop residues. It is considered developing because converting the cellulose into glucose is more challenging than in starches and sugars.
The International Energy Agency (IEA) predicts that ethanol will constitute two-thirds of the global growth in conventional biofuels with biodiesel and hydrotreated vegetable oil accounting for the remaining part (2018-2023). Global ethanol production is estimated to increase by 14% from about 120 bln L in 2017 to approximately 131 bln L by 2027. Brazil will accommodate fifty percent of this increase and will be used to fill in the domestic demand (OECD/FAO (2018), “OECD-FAO Agricultural Outlook”).

| Year | World Ethanol Trade in Billions of Liters | World Ethanol Production in Billions of Liters |
|---|---|---|
| 2010 | 6 | 104 |
| 2011 | 10 | 103 |
| 2012 | 9 | 101 |
| 2013 | 8 | 109 |
| 2014 | 7 | 115 |
| 2015 | 7 | 119 |
| 2016 | 9 | 118 |
| 2017 | 10 | 120 |
| 2018 | 9 | 123 |
| 2019 | 9 | 124 |
| 2020 | 9 | 125 |
| 2021 | 9 | 126 |
| 2022 | 9 | 127 |
| 2023 | 9 | 128 |
| 2024 | 9 | 129 |
| 2025 | 9 | 130 |
| 2026 | 9 | 130 |
| 2027 | 9 | 131 |
World production of ethanol-based by country is shown below. The US produces the most ethanol worldwide (~57%), primarily from corn. Brazil is the next largest producer with 27%, primarily from sugarcane. Other countries, including Australia, Columbia, India, Peru, Cuba, Ethiopia, Vietnam, and Zimbabwe, are also beginning to produce ethanol from sugarcane.

| Country | Percent (%) |
|---|---|
| US | 57% |
| Brazil | 27% |
| Europe | 6% |
| China | 3% |
| India | 2% |
| Canada | 2% |
| Rest of the World | 3% |
The figure below shows the growth of sugarcane in the world, in tropical or temperate regions. Sugar beet production in Europe is the other source of sugar for ethanol. It is grown in more northern regions than sugarcane, primarily in Europe and a small amount in the US. The next figure shows the growth of sugar beets in the world.


