
8.5. Wind Energy Applications and Technologies
Wind energy is primarily used for power generation. Wind power conversion systems have been increasingly employed in the U.S., Europe, India, and more sparingly in some other locations over the last decade, due to the development of technology that allows relatively high efficiency of the wind resource conversion. The key process is the conversion of the kinetic energy of moving air into the mechanical kinetic energy of the rotating shaft of the turbine. Similar to solar energy resource, one of the main challenges with wind power is its intermittence and high variability, which requires systematic adjustments in operation as well as strategies to integrate the wind power into the grid.
Video: Energy 101: Wind Turbines (2:16)
We've all seen those creaky old windmills on farms and, although they may seem about as low tech as you can get, those old windmills are the predecessors for new modern wind turbines that generate electricity. The same wind that used to pump water for cattle is now turning giant wind turbines to power cities and homes. Have a look at this wind farm in the California desert. A hot desert next to tall mountains. An ideal place for a lot of wind. Here's another one on the windy prairies of Wyoming. Now, today's wind turbines are much more complicated machines than the old prairie windmills, but the principle is the same. Both capture the wind's energy. Ok.
Here's how it works. First, a wind turbine blade works sort of like an airplane wing. Blowing air passes around both sides of the blade. The shape of the blade causes the air pressure to be uneven, higher on one side of the blade and lower on the other. And that's what makes it spin. The uneven pressure causes the blades to spin around the center of the turbine. On the top, there's a weather vane that's connected to a computer to keep the turbine turned into the wind, so it captures the most energy. Now, the blades are attached to a shaft which only turns about 18 revolutions a minute. And that's not nearly fast enough to generate electricity by itself. So, the rotor shaft spins a series of gears that increase the rotation up to about 1,800 revolutions per minute. And at that speed, a generator can produce a lot of electricity.
So, why are wind turbines so tall? Well, the higher up you go, the windier it is. More wind naturally means more electricity. And in many cases, larger turbines can also capture wind energy more efficiently. The blades can sweep a circle in the sky as long as a football field. Now, what's really cool is that even a small wind farm, like this one in Wyoming, can generate enough electricity to power more than 9,000 homes. And larger farms can provide much more clean energy for our homes and businesses.
Please refer to the following reading source for learning about wind energy systems below.
Reading Assignment:
Book chapter: F.M. Vanek and L.D. Albright, Energy Systems Engineering: Evaluation and Implementation, McGraw Hill, 2008 – Chapter 12 Wind Energy Systems, pp. 331-366. (See E-Reserves in Canvas.)
This chapter contains sufficient background on the topic, including global perspective of the technology, some technical details and performance parameters, and economic insight. Here, our goal is to understand the main characteristics of the system (both technical and economic) that can be useful for technology evaluation.
Focus Questions
Read pages 331-348 more carefully; you can just scan through the rest of the chapter. (We will not dig into the turbine design since it is beyond the scope of this course). While reading, try to spot the answers to the following questions:
- How is wind resource measured?
- How can we estimate the average wind speed at a particular locale?
- How do we estimate the available power of wind?
- What are the most favorable and least favorable wind conditions for high efficiency wind power conversion?
- Can you explain the meaning of capacity factor of a wind turbine?
Energy return on investment (EROI)
EROI is a common metric applied to the energy conversion systems. It is defined as the ratio of the lifetime usable energy generated by the system to the energy spent for the system manufacturing, operation, maintenance, and disposal. Obviously, EROI = 1 would mean that over its lifetime a system produces as much energy as has been consumed for its creation and operation. Such a situation would indicate very low feasibility.
For wind turbines, the typical estimate of the EROI is in the range from 5 to 35, depending on the type of system. This indicator significantly increases with the size of the turbine rotor. The latest generation large-scale turbines yield EROI values about 35 and higher (Kubiszewski et al., 2010).
Status of technology
The wind power generation systems have been commercialized for several decades now. The efficiency and durability of the systems was improved over time. So, recent developments explain the growing interest in wind energy and observed growth of wind energy market. Read more on the status of this technology in the NREL report:
Reading Assignment:
NREL Report: R. Thresher, M. Robinson, P. Veers, Wind Energy Technology: Current Status and R&D Future, NREL, 2008.
Economic aspects
Economic analysis of renewable energy systems mainly focuses on the ability of the system to pay back the initial investment and operation costs within a reasonable period of time.
The lifetime cost of the wind energy system can be split into the (i) initial cost for system manufacturing and installation, (ii) operating and maintenance cost, and (iii) decommission cost.
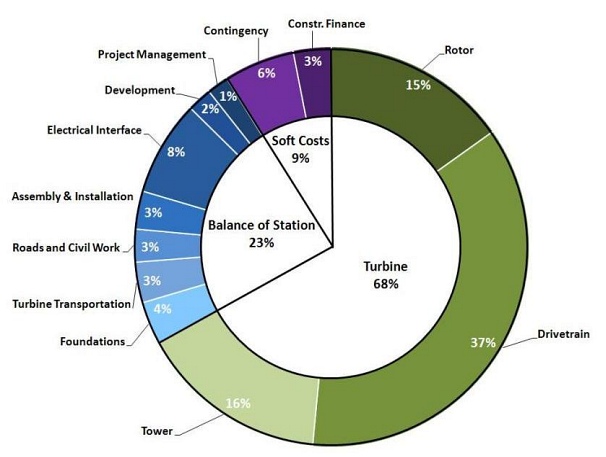
The initial upfront cost of wind energy system is usually the highest (~75%) and typically includes turbine (including rotor, tower, drivetrain), foundation, land rent, electrical equipment, connection to the grid, road construction and other infrastructure, transportation, installation labor and expertise, and associated soft costs (Figure 8.5).
Operating and maintenance costs are relatively low, especially that there is no fuel cost involved.
| per kW capacity | total for 1.5 MW turbine system | |
|---|---|---|
| Capital cost | $2,098 | $3,147,000 |
| Annual operating cost | $35 | $52,500 |
| Lifetime cost (25 years) | $2,973 | $4,459,500 |
Taking into account the typical costs listed in Table 8.2, one can perform a standard cost analysis to find out how long would it take for the wind system to pay back investments. Feasibility would depend on the lifetime of the system itself and how it compares to the payback period. Please refer to the example below, which tries to examine this question
Example:
Consider a simple payback estimate example here:
Question: What would be a simple payback time for a 1.5 MW wind turbine that produces annually 4,800 MWh of electricity (net generation)? Use the capital cost and annual operating cost from Table 8.2.
First, we can express the lifetime cost of the 1.5 MW system as:
Total cost = $3,147,000 + n x 52,500
where n is the number of years. Note, we are ignoring the salvage value or decommission cost in this example.
We assume that the facility is able to sell the electricity at a realistic average price of $0.05/kWh. (In reality, the market price for wind-generated power can vary). So, the total revenue generated through electricity sales will be:
Total revenue = 4,800 MWh/year x n years x 0.05 $/kWh = 240,000n
Then, simple payback time can be found by solving for n the balance equation between the total cost and total revenue:
3,147,000 + 52,500n = 240,000n
n = 16.78 years - will be necessary to cover the investment. This time is roughly 1/2 the lifetime of the turbine system.
The payback can be reached sooner if we consider a premium some customers would pay for purchasing "green" electricity. At the same time, if there is an interest rate on the initial investment (MARR), it will extend the payback period.
As a rule, the small-scale residential wind energy system have longer payback period, because they typically operate at less favorable wind conditions; so the capacity factors are usually lower (~10%) than that for the commercial utility scale wind systems (~30%)
More information on wind energy economics and costs can be found in the following reading (which is optional for this lesson):
Supplemental Reading on Wind Energy Economics and Costs:
- S. Tegen, E. Lantz, M. Hand, B. Maples, A. Smith, and P. Schwabe, 2011 Cost of Wind Energy Review, NREL (2011).