3.2.6: Maximum Allowable Stripping Ratio (SRmax)
Earlier in this lesson, we looked at the maximum stripping ratio, and we did it for coal seam. You will recall that the maximum allowable stripping ratio, SRmax, also called break-even stripping ratio, is the maximum amount of overburden/waste that can be extracted per unit of ore at the economic pit limit. The SRmax is determined solely by economics, to establish the ultimate boundary of the pit, where break even occurs, i.e. the profit margin is zero. As we defined it before,
So, it is a physical quantity that is determined by economics. This value can be simply converted to the unit of tonsw/tono, considering the density of the waste material. If the ISR exceeds the SRmax , then the operation will be uneconomical as the income generated by the ore will be insufficient to offset the costs incurred in mining.
Now, let’s imagine a massive irregular deposit, where copper ore is the only ore that is desired to be mined out. Unlike coal deposits, metals are not extracted in their native form, except in rare cases. Instead, the rock has a small percentage of valuable minerals in it. A copper deposit contains rock that can be profitably mined and processed to extract the copper. However, the amount of copper contained within the rock, i.e. the grade, varies by location. We’ll need to account for this in our calculation of the break-even stripping ratio.
The only difference is that ore grade variation should be taken into account in the calculation. In order to determine the SRmax for such a deposit, the orebody is divided into different blocks of ore. The average ore grade for each block is determined, and then the overall grade of the ore in the slice is calculated as follows:
where is the average ore grade in the slice, is the length of the ore section that has a grade equal to .
After you calculate the average ore grade for the slice, you can use a grade - stripping ratio (g-SR) plot to determine the SRmax associated with the determined average ore grade. Here is an example of a g-SR plot.
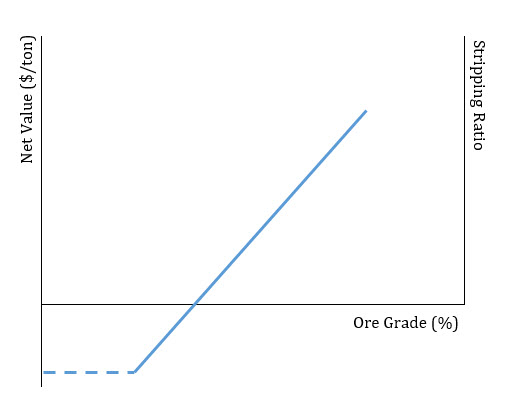
Imagine a copper deposit in which the average copper grade for a strip is 1.05%. Checking the g-SR plot for that deposit, suppose we find out that the SRmax for = 1.05 is equal to 8.5. This means that 8.5 units of waste can be economically removed per unit of ore. If the ISR for the strip is smaller than the SRmax , then the pit could be extended and more strips could be mined profitably. If the ISR and SRmax are equal, then this is a good place for the pit limit. If the ISR is larger than SRmax, then we have passed the economic location for the pit limit.
In MNG 441, you will learn how to determine break-even cutoff grade and draw a g-SR plot using economic parameters. Here, I simply want you to know about this plot and what it is representing.