When we generate information about phenomena that occur on or near the Earth’s surface, we do so using geographic data. Geographic data are data that include a reference to location on the Earth together with some non-spatial attributes. To be useful, they also need to include an indication of when the data refer to. The location specification is a key difference from other types of information that might only have an ID number or other descriptors, like the example in Table 1.1. When locational data are added (Table 1.2), these locations alone may be used to access the data, or one may combine location and non-spatial attributes to access data more specifically, such as when asking, “Which emergency vehicles of the type ‘ambulance’ are within 40 miles of my current location?”
| ID | Type | Description |
|---|---|---|
| 42 | Patrol | Light-weight veh.. |
| 43 | Intercept | Performance crui.. |
| 44 | Ambulance | 2-axel diesel truc.. |
This is not geographic data. It does not have any locational data. Credit: Joshua Stevens, Department of Geography, The Pennsylvania State University.
The data in Table 1.1 above could not be used to answer the question posed. These data could only answer questions such as “which vehicle(s) is/are an ambulance?” (with an answer of ‘#44’) or “Are there any heavy-weight patrol cars in the fleet?” (with an answer of ‘no’). These data cannot answer any “where….?” question, because locations are not encoded.
By including coordinate information in the form of longitude and latitude, the data in Table 1.2 are geographic data. These spatial attributes can be used to identify the location of each item in the database, allowing us to ask questions of the type “where…?” and “how far…?”
| ID | Type | Description | Latitude | Longitude |
|---|---|---|---|---|
| 42 | Patrol | Light-weight veh.. | 40.776853 | -77.87650 |
| 43 | Intercept | Performance crui.. | 34.594421 | -80.301819 |
| 44 | Ambulance | 2-axel diesel truc.. | 34.612899 | -79.635086 |
These geographic data have spatial attributes that can be used to link each entity to a place in the real world. (Locational Data highlighted in table above.) Credit: Joshua Stevens, Department of Geography, The Pennsylvania State University.
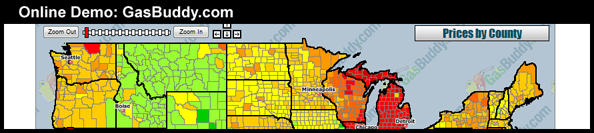
Later chapters will cover coordinates in more detail. The key point is that spatial attributes tell us where things are, or where things were at the time the data were collected. By simply including spatial attributes, geographic data allow us to ask a plethora of geographic questions. For example, we might ask “are gas prices in PA high?” The interactive map from GasBuddy.com can help us with such a question while enabling us to generate many other spatial inquiries related to the geographic variation in fuel prices. Section 1.6 of this chapter will provide several more examples of these questions and the types of geographic data that can be used to answer them.
Another important characteristic of geographic space is that it is "continuous.” Although the Earth has valleys, canyons, caves, etc., there are no places on Earth without a location, and connections exist from one place to another. Outside of science fiction, there are no tears in the fabric of space-time. Modern technology can measure location very precisely, making it possible to generate extremely detailed depictions of geographic feature location (e.g., of the coastline of the eastern U.S). It is often possible to measure so precisely that we collect more location data than we can store and much more than is actually useful for practical applications. How much information is useful to store or to display in a map will depend on the map scale (how much of the world we represent within a fixed display such as the size of your computer screen) as well as on the map’s purpose.
Geographic data are generalized according to scale. Click on the buttons beneath the map to zoom in and out on the town of Gorham. (source: U.S. Geological Survey, public domain).
For example, the illustration above shows a town called Gorham (in Maine) depicted on three different maps produced by the United States Geological Survey. Take note of the changes that occur when you select different scales (click the buttons below the map to change scale). The shape of the town along with the number and type of features included on the map are different at each scale. The cartographer has made generalization decisions to make sure that the information depicted is legible at each scale and to meet expected uses of maps produced at that scale.
As the map scale becomes larger (when you “zoom in”), the features become larger and more detailed. Switching to smaller scales (“zooming out”) reduces the number of features and simplifies their shapes. This feature reduction and simplification is an example of an important data processing operation called map generalization. Map generalization is a process that involves selecting which features of the world to represent (given what is possible with available data, which also will be selective) and multiple choices about the visible detail included in those representations. In the Gorham example, at the largest scale (1:24,000), all built structures in Gorham are depicted, while at 1:62,000, the built-up area is depicted abstractly as a pink polygon and you (as the map reader) are left to infer that towns include buildings. At the smallest scale (1:250,000), in addition to there being even fewer features depicted, many of the linear features have been smoothed out (e.g., highway 25 on the 1:250,000 map appears to have a slight, gentle curve as it cuts through town while its depiction on the 1:24,000 scale map shows that it has a distinct jog as well as an intersection that will appear to a driver as a U-turn).
In addition to being continuous, geographic data also tend to be spatially dependent. More simply, "everything is related to everything else, but near things are more related than distant things" (which leads to an expectation that things that are near to one another tend to be more alike than things that are far apart). The quote is the First Law of Geography, attributed to geographer Waldo Tobler (1970) -- University of California Department of Geography. How alike things are in relation to their proximity to other things can be measured by a statistical calculation known as spatial autocorrelation. Without this fundamental property, geographic information science as we know it today would not be possible.