The table in Figure 1.2 of the previous section demonstrates one way to communicate geographic information. We can list data as a series of rows and columns and indicate locations with very specific coordinates. Despite being complete and efficient representations of data, text written in columns and rows is not very user friendly or easy for human beings to interpret. A visual representation would be much better.
The use of graphics and imagery as forms of communication predates written language by several thousand years. It is no surprise then that humans began to visually depict geographic information and have been doing so for millennia. Although the first graphic depiction of geographic information is debated (it is easy to imagine ephemeral maps drawn with sticks in the sand of a beach long before paper or even cave paintings), one of the earliest surviving representations to include both an indication of scale and orientation is the town plan of Nippur, created circa 1330 BC (O'Grady and O'Grady 2008); for a photo of this plan, see: Archaeology.org: Maps Exhibit review.
Try This: How would you define a map?
What is a map...exactly?
While there is a consensus that maps are extremely effective forms of communication, there are numerous definitions of what maps actually are and these definitions vary considerably. To understand why that is, let’s perform a simple exercise. Take a look at the images in Figure 1.5 below and decide which, if any, of them are maps.
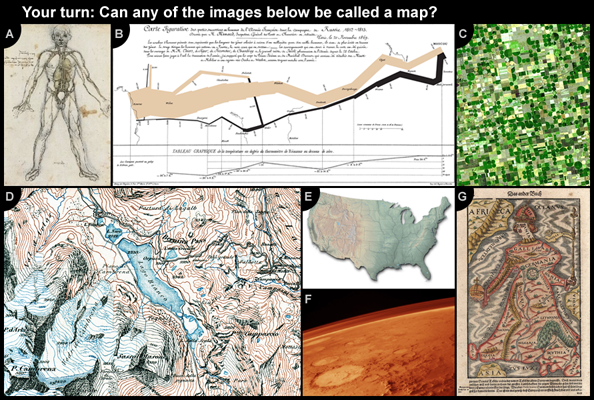
It might surprise you, but with the right definition, each of the images above could qualify as a map. All of them rely on the spatial arrangement of information to communicate, and it is the spatial relationships between the elements in each image that provides meaning. Although they are not all geographic, the maps above introduce the idea of abstraction, or the process of representing phenomena or ideas with a simplified counterpart.
The idea of a map, with which you might be most familiar, is also an abstraction. Geographic maps are abstractions of the world we live in and phenomena on, within, or above its surface. As abstractions, maps allow features in the real world to be represented in paper, digital media, and databases, allowing us to calculate, present, and better understand the relationships that objects in the real world have with one another. In this course, you will learn about two primary types of maps: reference maps and thematic maps, defined more completely in Chapter 3.
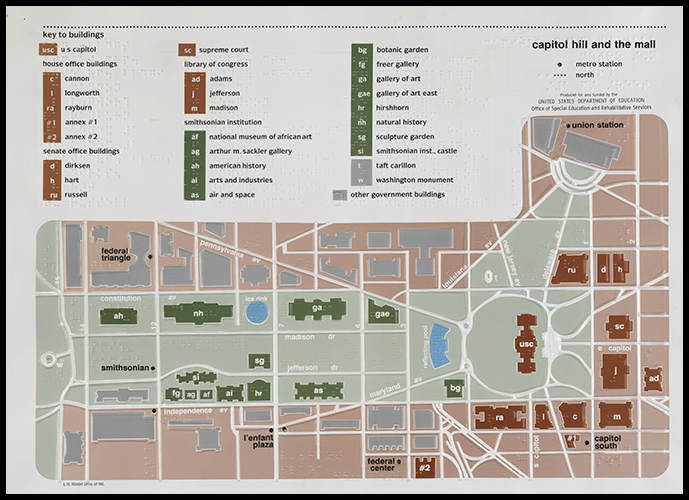
As can be seen above, and in dictionary definitions, the term “map” is used well beyond geographic representations (e.g., Merriam-Webster definition). Even when a geographic context is assumed, definitions include a wide range of representation forms. The International Cartographic Association has developed the following definition of geographic maps: “A map is a symbolised image of geographical reality, representing selected features or characteristics, resulting from the creative effort of its author’s execution of choices, and is designed for use when spatial relationships are of primary relevance.” This definition still allows tremendous variety. The definition is intentionally broad to include, for example, tactile maps for the visually impaired as shown below in Figure 1.4.
Practice Quiz
Registered Penn State students should return now take the self-assessment quiz About Maps.
You may take practice quizzes as many times as you wish. They are not scored and do not affect your grade in any way.