CNSI considered several geological, hydrological, surface and subsurface land use criteria in the first stage of its LLRW siting process.
|
STAGE ONE: STATEWIDE SCREENING CRITERIA |
|
|
GEOLOGICAL CRITERIA
|
|
|
HYDROLOGICAL CRITERIA
|
|
|
SURFACE LAND USE CRITERIA
|
|
|
SUBSURFACE LAND USE CRITERIA
|
|
|
|
|
CNSI's GIS subcontractors created separate digital map layers for every criterion. Sources and procedures used to create three of the map layers are discussed briefly below.
One of the geological criteria considered was carbonate lithology. Limestone and other carbonate rocks are permeable. Permeable bedrock increases the likelihood of ground water contamination in the event of a LLRW leak. Areas with carbonate rock outcrops were therefore disqualified during the first stage of the screening process. Boundaries of disqualified areas were digitized from the 1:250,000-scale Geologic Map of Pennsylvania (1980). What concerns would you have about data quality given a 1:250,000-scale source map?
Analysts needed to make sure that the LLRW disposal facility would never be inundated with water in the event of a coastal flood, or a rise in sea level. To determine disqualified areas, CNSI's subcontractors relied upon the Federal Emergency Management Agency's Flood Insurance Rate Maps (FIRMs). The maps were not available in digital form at the time, and did not include complete metadata. According to the CNSI interim report, "[t]he 100-year flood plains shown on maps obtained from FEMA ... were transferred to USGS 7.5-minute quad sheet maps. The 100-year flood plain boundaries were digitized into the GIS from the 7.5-minute quad sheet maps." (Chem Nuclear Systems, 1991, p. 11) Why would the contractors go to the trouble of redrawing the floodplain boundaries onto topographic maps prior to digitizing? What kinds of error might be generated by this process?
Areas designated as "exceptional value watersheds" were also disqualified during Stage One. Pennsylvania legislation protected 96 streams. Twenty-nine additional streams were added during the site screening process. "The watersheds were delineated on county [1:50,000 or 1:100,000-scale topographic] maps by following the appropriate contour lines. Once delineated, the EV stream and its associated watershed were digitized into the GIS." (Chem Nuclear Systems, 1991, p. 12) What digital data sets could have been used to delineate the watersheds automatically, had the data been available?
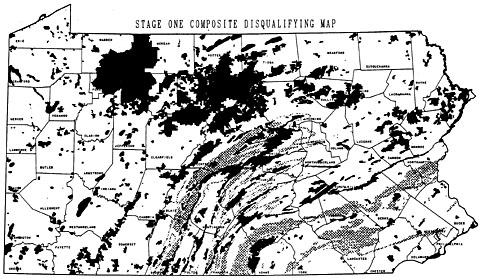
After all the Stage One maps were digitized, georegistered, and overlayed, approximately 23 percent of the state's land area was disqualified.