Multivariate Dot and Proportional Symbol Maps
Another commonly-used thematic map type for multivariate mapping is the proportional symbol map. Making these types of maps is often easier than making bivariate choropleth maps. As the main visual variable used in proportional symbol mapping is size, another variable can be added quite easily—color. The challenge lies in their interpretation: as the visual variables of size and color are quite different, this can make it challenging for the multiple variables on the map to be directly compared by readers.
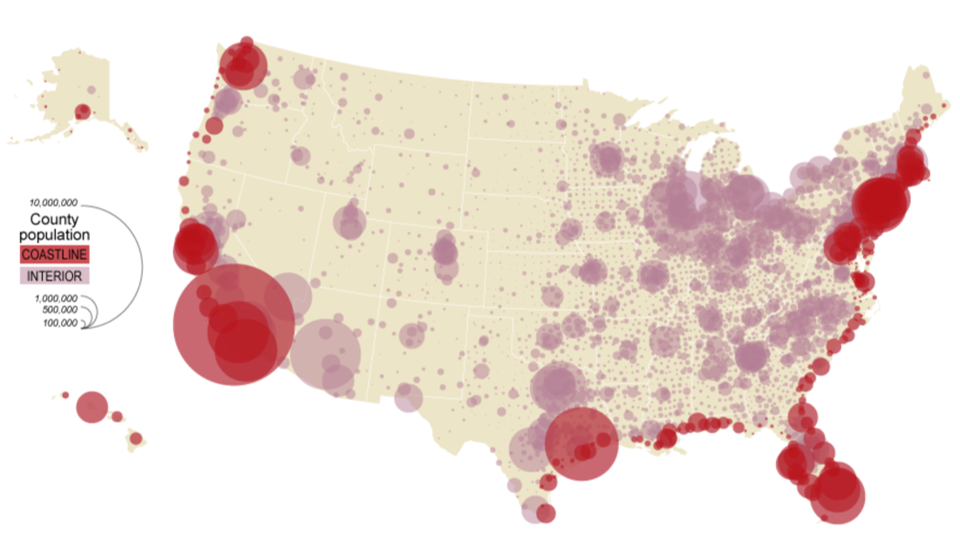
Figure 7.3.1 above is a bivariate proportional symbol map that visualizes two variables: population by county (a quantitative variable, with the visual variable size) and coastline vs. interior (a qualitative variable, with the visual variable color hue).
Student Reflection
Imagine you were tasked to create the map above, but instead of symbolizing points as coastline vs. interior, you were asked to symbolize all points by income per capita (in addition to population). What would you change about this map design to fit that new data?
Another method of multivariate map design is to stack multiple layers so they can be viewed simultaneously. Often, this is done by displaying proportional or graduated symbols on top of a choropleth or isoline map. An example is shown in Figure 7.3.2.
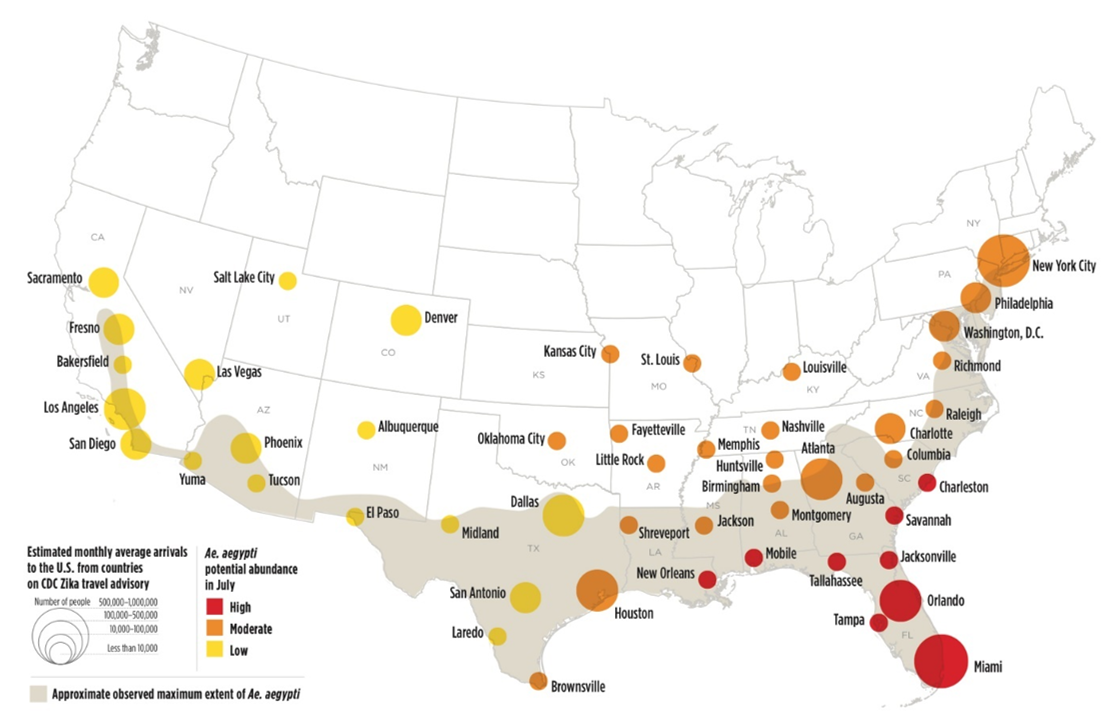
In the map above, visual emphasis is placed on the proportional symbols: they use size to symbolize a primary variable of interest—the estimated count of people in each city who arrived there after visiting a country on the CDC’s Zika travel advisory list. Another variable, Ae. aegypti (a mosquito capable of transporting the Zika virus) abundance, is visualized with color lightness/hue. A third variable—the approximate observed maximum extent of this mosquito, is visualized in the background for additional context. Note the careful legend design.
Making a map such as this one is a challenge, but is an example of how related variables can be mapped together to create an engaging and useful map.
Recommended Reading
Nelson, Elisabeth S. 1999. “Using Selective Attention Theory to Design Bivariate Point Symbols.” Cartographic Perspectives Winter (32): 6–28.