In this walkthrough, you'll put together some of the things you've learned in this lesson to make a well-rounded informational map containing thematic styling and Leaflet controls. The map will use the Bootstrap web presentation framework so that it can be extended with supplementary content in an aesthetically pleasing way. You will construct some of this content on the fly by reading the attributes of selected map features.
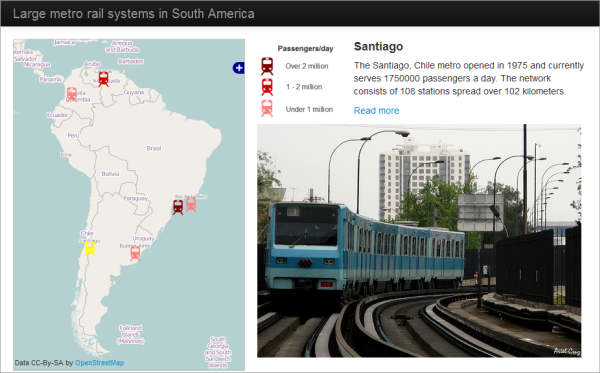
For this exercise, we'll stick with the metro data from South America. The final application will allow users to click any metro and see some informational text and an image from Flickr. A static legend image is also brought into the layout.
Although this lesson is called "Going beyond 'dots on a map," I have deliberately chosen point data for this walkthrough so that you can appreciate the possibilities offered through Leaflet, especially when tied together with other frameworks. Although you may not feel like a JavaScript guru at this point, you should at least know that you don't have to settle for the 'red teardrop and popup' mashups that you see all over the Internet.
Downloading the data and examining the layout
- Download the Lesson 8 walkthrough data and unzip it anywhere. If you like, you could place the files in your Jetty home folder, but the walkthrough does not use GeoServer and this is not required. The files include a legend image, the metro SVG images, and a GeoJSON file of metro locations and attributes. Notice that in a departure from previous walkthroughs, I've already supplied an HTML file containing the basic layout markup. We will examine some of the key pieces of the markup in the steps below. You'll also add some JavaScript to give this app some life. Also, please note that the files include a style.css file like we used in the previous lessons, but with one important change: The width attribute of the map has been changed from a fixed absolute number of pixels to a relative value (90%) to make sure that the div section for the map will work together with the Bootstrap layout template we will use in this walkthrough.
- Open lesson8_walkthrough.html in a web browser and take a look. You should see the empty shell of the app with no map yet.
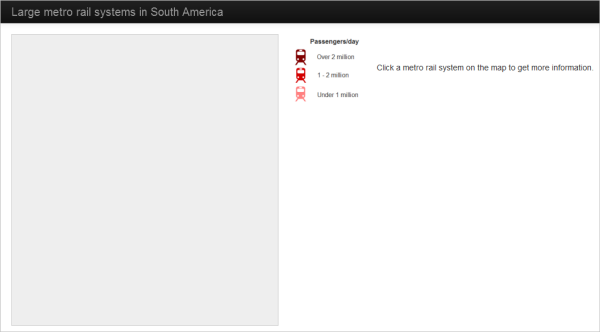 Figure 8.13.
 - Open lesson8_walkthrough.html in your favorite text editor and look over the HTML markup. The layout is based on an old OpenLayers and Bootstrap example that doesn't seem to be available online anymore.
Before you add JavaScript, I will just point out a few things that are important in the layout. First, notice how Bootstrap is brought into the application through a reference to a JavaScript file (.js) and a CSS file (.css) in the bolded lines below. We are referencing the files from a CDN, but you could alternatively download and host (and tweak) them yourself.
<script src="http://code.jquery.com/jquery-latest.js"></script>
. . .
<script src="https://maxcdn.bootstrapcdn.com/bootstrap/2.2.1/js/bootstrap.min.js"></script>
<link rel="stylesheet" href="https://maxcdn.bootstrapcdn.com/bootstrap/2.2.1/css/bootstrap.min.css">
Also take note of the stylesheet override in the <style> tag. This will prevent our page content from crashing into the top banner.
<style>
  body {
    padding-top: 60px;
    padding-bottom: 40px;
  }
</style>
If you don't like something about the Bootstrap (or Leaflet) default styles, the stylesheet overrides are where you can apply a change.
In the page body, observe how classes are used to organize the page into navigation bars (navbar-*), containers (container-fluid), and spans. The span5 and span7 classes divide the page vertically so that consistent proportions of the page area are devoted to the map (on the left) and the supplementary material (on the right). Don't worry about understanding all these classes at this point. Just be aware that web development frameworks like Bootstrap, Dojo, etc., may give you CSS classes for organizing page elements in a way that should behave consistently across browsers.
Finally, note that the legend image and the "Click a metro..." text are organized into an HTML table to keep them flush. The table borders are invisible by design.
<table>
  <tr>
    <td><img src="metro_legend.png"/></td>
    <td id = 'summaryLabel'><p>Click a metro rail system on the map to get more information.</p></td>
  </tr>
</table>
A div awaits for a Flickr image, but this won't appear until someone clicks a metro symbol on the map.
<div id="metroImage"></div>
Now let's breathe some life into this app by adding some JavaScript code.
Adding the JavaScript logic
You'll use JavaScript to do three main things in this application: add the map, define the symbols, and handle the click events. Let's address these in order.
-
In your lesson8_walkthrough.html, find the script tags. You'll put all your code immediately after: <script type="text/javascript">.
-
Add the following lines of code to create the map and an initialization function. This function contains some variables that we'll use to handle selections throughout, similar to what you saw in Lesson 7:
var map; var metroLayer; function init() { // create map and set center and zoom level map = new L.map('mapid'); map.setView([-28,-62],3); var selection; var selectedLayer; var selectedFeature; . . . } - Now let's create some layers and put them on the map. The code below creates two tiled basemap layers and the metro layer. It only adds one basemap layer to the map; the other one will eventually be an option in the layer switcher.
One more note regarding the two basemap layers: Until recently, we used the standard OSM basemap as the first basemap option and the dark-themed Stamen Toner basemap as the second option in this walkthrough. However, since November 2023 the Stamen basemap tiles are not hosted by Stamen anymore but instead are provided by a company called Stadia as part of one of the plans they are offering to their customers, including a free plan for up to 200,000 requests (see this page for details: https://docs.stadiamaps.com/guides/migrating-from-stamen-map-tiles/). We therefore changed this walkthrough to use a second OSM basemap called OSM Humanitarian as the second option. If you instead would like to use the original Stamen Toner basemap, what you can do is follow the steps described on the migration page linked above: (1) create a Stadia account and pick the free plan, (2) pick the option to use an API key to access their tiles, and (3) use the following URL for the second basemap option in the code below replacing xyz with your API key:'https://tiles.stadiamaps.com/tiles/stamen_toner/{z}/{x}/{y}.png?api_key=xyz'Now replace the . . . in the code above with the following. Although it's a lot, all of this should look pretty familiar if you paid attention to the code snippets earlier in the lesson:// create and add osm tile layer var osm = L.tileLayer('https://{s}.tile.openstreetmap.org/{z}/{x}/{y}.png', { maxZoom: 19, attribution: '© <a href="http://www.openstreetmap.org/copyright">OpenStreetMap</a>' }); osm.addTo(map); // create osm humanitarian layer (not adding it to map) var osmHumanitarian = L.tileLayer('https://{s}.tile.openstreetmap.fr/hot/{z}/{x}/{y}.png', { maxZoom: 19, attribution: '© <a href="http://www.openstreetmap.org/copyright">OpenStreetMap</a>' }); // create metro icons var metroLowIcon = L.icon({ iconUrl: 'metro_low.svg', iconSize: [25,25] }); var metroMediumIcon = L.icon({ iconUrl: 'metro_medium.svg', iconSize: [25,25] }); var metroHighIcon = L.icon({ iconUrl: 'metro_high.svg', iconSize: [25,25] }); var metroSelected = L.icon({ iconUrl: 'metro_selected.svg', iconSize: [25,25] }); // add the metro GeoJSON layer var metroLayer = L.geoJson(metroData,{ pointToLayer: function (feature, latlng) { return L.marker(latlng, {icon: iconByPassday(feature)}); }, onEachFeature: metrosOnEachFeature }); metroLayer.addTo(map); . . .You may have noticed that the metroLayer relies on two functions: iconByPassday and metrosOnEachFeature. We'll tackle those in a few minutes. But first, the layer switcher...
-
Replace the . . . in the code above to add a layer switcher control to the map:
// define basemap and thematic layers and add layer switcher control
var basemaps = {
  "OSM": osm,
  "OSM Humanitarian": osmHumanitarian
};

var overlays = {
  "Metro stations": metroLayer
 };

L.control.layers(basemaps,overlays).addTo(map);

. . .
Again, the pattern here is to create a JavaScript object for the basemaps and one for the thematic layers, and then pass those two objects in as parameters when you create the control. -
Now for those functions I mentioned. The first one, iconByPassday, looks at the number of passengers per day that travel through each metro system, then decides which icon to use. It's the key to classifying the layer and symbolizing it with the different colors. Replace the . . . in the code above with the following:
// define functions that right icon for a given feature function iconByPassday(feature) { var icon; if (feature.properties.PASSDAY >= 2000000) icon = metroHighIcon; else if (feature.properties.PASSDAY >= 1000000) icon = metroMediumIcon; else icon = metroLowIcon; return icon; } . . . -
Now for that metrosOnEachFeature function. This one is a little more lengthy. It adds a click event listener to the metros layer and then defines a function to handle that event. Replace the . . . in the code above with the following:
// define function to handle click events on metro features
function metrosOnEachFeature(feature, layer){
  layer.on({
    click: function(e) {
      // reset symbol of old selection
      if (selection) {
        if (selectedLayer === metroLayer) selection.setIcon(iconByPassday(selectedFeature));
      }

      // apply yellow icon to newly selected metro and update selection variables
      e.target.setIcon(metroSelected);
      selection = e.target;
      selectedLayer = metroLayer;
      selectedFeature = feature;

      // using attributes, construct some HTML to write into the page
      var featureName = feature.properties.CITY || 'Unnamed feature';
      var country = feature.properties.COUNTRY || '(Unknown)';
      var year = feature.properties.YEAR || '(Unknown)';
      var passengers = feature.properties.PASSDAY || '(Unknown)';
      var stations = feature.properties.STATIONS || '(Unknown)';
      var length = feature.properties.LENGTHKM || '(Unknown)';
      var link = feature.properties.LINK || 'http://www.wikipedia.org';
      var photoHtml = feature.properties.PHOTO || '<P>Photo not available</P>';
      var titleHtml = '<p style="font-size:18px"><b>' + featureName + '</b></p>';
      var descripHtml = '<p>The ' + featureName + ', ' + country + ' metro opened in ' + year + ' and currently serves ' + passengers + ' passengers a day. The network consists of ' + stations + ' stations spread over ' + length + ' kilometers.</p>';
      var readmoreHtml = '<p><a href="' + link + '">Read more</a></p>';
      document.getElementById('summaryLabel').innerHTML = titleHtml + descripHtml + readmoreHtml;
      document.getElementById('metroImage').innerHTML = photoHtml;

      L.DomEvent.stopPropagation(e); // stop click event from being propagated further
    }
  });
}

. . .
Examine the code comments above to understand what each section is doing. There's a lot of code, but most of it is constructing the informational HTML describing the metro system. Recall that the attribute table looks like this: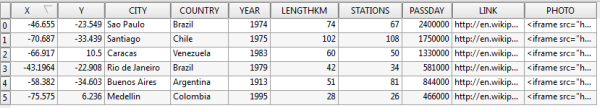 Figure 8.15.
You should notice many of these attribute field names referenced in the code above. The field value is retrieved, using some special syntax || (logical OR operator that in JavaScript returns the first operand that is TRUE) to set a fallback value in case no attribute comes back. The rest of the function constructs some HTML strings, inserting the attributes where appropriate. After the HTML strings are constructed, the innerHTML is updated for the elements "summaryLabel" and "metroImage." This causes the new text and the photo to appear on the right side of the page.
The PHOTO field deserves some additional discussion here. Anticipating that this field would be used to embed a photo in an app, the entire iframe HTML code is placed in this field as a long string. Where do you get this code if you want to make a dataset like this? Right from the Flickr embed functionality: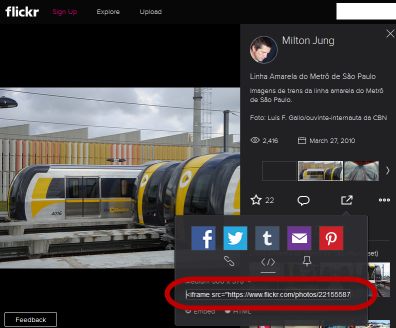 Figure 8.16.
 -
Finally, add a click event handler to the map that will reset the selection. This is necessary if someone clicks the map, but not a metro icon. Replace the . . . in the code above with the following:
// define and register event handler for click events to unselect features when clicked anywhere else on the map
map.addEventListener('click', function(e) {
  if (selection) {
    if (selectedLayer === metroLayer) selection.setIcon(iconByPassday(selectedFeature));

    selection = null;

    document.getElementById('summaryLabel').innerHTML = '<p>Click a metro rail system on the map to get more information.</p>';
    document.getElementById('metroImage').innerHTML = ''
  }
});
Notice that some code was added here to also clear out the informational HTML and the photo. -
Test the application by opening lesson8_walkthrough.html in a web browser. (If you're just opening the HTML file directly from the file system, I recommend using Firefox to test. This is because the cross-origin request security implementations in Chrome and Internet Explorer only allow the GeoJSON to load if you're hosting both the HTML and GeoJSON files on a web server.)
You should be able to switch between different base layers (note that the Map Quest open layer shown below is no longer available). Click a metro icon to see the highlighted symbol, the Flickr image, and the descriptive text.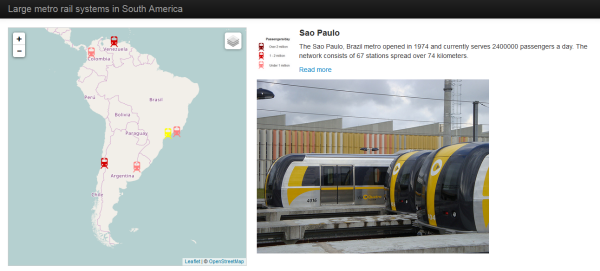 Figure 8.17.
Final code for the walkthrough
If the walkthrough does not function, check to ensure you are connected to the Internet and that your code matches the code below:
<!DOCTYPE html>
<html>
<head>
<meta http-equiv="Content-Type" content="text/html; charset=utf-8">
<title>Lage metro rail systems in South America</title>
<link rel="stylesheet" href="https://cdnjs.cloudflare.com/ajax/libs/leaflet/1.2.0/leaflet.css" type="text/css" crossorigin="">
<script src="https://cdnjs.cloudflare.com/ajax/libs/leaflet/1.2.0/leaflet.js" crossorigin=""></script>
<script src="http://ajax.googleapis.com/ajax/libs/jquery/1.9.1/jquery.min.js"></script>
<script src="metro.js"></script>
<link rel="stylesheet" href="style.css" type="text/css">
<script src="https://maxcdn.bootstrapcdn.com/bootstrap/2.2.1/js/bootstrap.min.js"></script>
<link rel="stylesheet" href="https://maxcdn.bootstrapcdn.com/bootstrap/2.2.1/css/bootstrap.min.css">
<style>
body {
padding-top: 60px;
padding-bottom: 40px;
}
</style>
<script type="text/javascript">
var map;
var metroLayer;
function init() {
// create map and set center and zoom level
map = new L.map('mapid');
map.setView([-28,-62],3);
var selection;
var selectedLayer;
var selectedFeature;
// create and add osm tile layer
var osm = L.tileLayer('https://{s}.tile.openstreetmap.org/{z}/{x}/{y}.png', {
maxZoom: 19,
attribution: '© <a href="http://www.openstreetmap.org/copyright">OpenStreetMap</a>'
});
osm.addTo(map);
// create osm humanitarian layer (not adding it to map)
var osmHumanitarian = L.tileLayer('https://{s}.tile.openstreetmap.fr/hot/{z}/{x}/{y}.png', {
maxZoom: 19,
attribution: '© <a href="http://www.openstreetmap.org/copyright">OpenStreetMap</a>'
});
// create metro icons
var metroLowIcon = L.icon({
iconUrl: 'metro_low.svg',
iconSize: [25,25]
});
var metroMediumIcon = L.icon({
iconUrl: 'metro_medium.svg',
iconSize: [25,25]
});
var metroHighIcon = L.icon({
iconUrl: 'metro_high.svg',
iconSize: [25,25]
});
var metroSelected = L.icon({
iconUrl: 'metro_selected.svg',
iconSize: [25,25]
});
// add the metro GeoJSON layer
var metroLayer = L.geoJson(metroData,{
pointToLayer: function (feature, latlng) {
return L.marker(latlng, {icon: iconByPassday(feature)});
},
onEachFeature: metrosOnEachFeature
});
metroLayer.addTo(map);
// define basemap and thematic layers and add layer switcher control
var basemaps = {
"OSM": osm,
"OSM Humanitarian": osmHumanitarian
};
var overlays = {
"Metro stations": metroLayer
};
L.control.layers(basemaps,overlays).addTo(map);
// define functions that right icon for a given feature
function iconByPassday(feature) {
var icon;
if (feature.properties.PASSDAY >= 2000000) icon = metroHighIcon;
else if (feature.properties.PASSDAY >= 1000000) icon = metroMediumIcon;
else icon = metroLowIcon;
return icon;
}
// define function to handle click events on metro features
function metrosOnEachFeature(feature, layer){
layer.on({
click: function(e) {
// reset symbol of old selection
if (selection) {
if (selectedLayer === metroLayer) selection.setIcon(iconByPassday(selectedFeature));
}
// apply yellow icon to newly selected metro and update selection variables
e.target.setIcon(metroSelected);
selection = e.target;
selectedLayer = metroLayer;
selectedFeature = feature;
// using attributes, construct some HTML to write into the page
var featureName = feature.properties.CITY || 'Unnamed feature';
var country = feature.properties.COUNTRY || '(Unknown)';
var year = feature.properties.YEAR || '(Unknown)';
var passengers = feature.properties.PASSDAY || '(Unknown)';
var stations = feature.properties.STATIONS || '(Unknown)';
var length = feature.properties.LENGTHKM || '(Unknown)';
var link = feature.properties.LINK || 'http://www.wikipedia.org';
var photoHtml = feature.properties.PHOTO || '<P>Photo not available</P>';
var titleHtml = '<p style="font-size:18px"><b>' + featureName + '</b></p>';
var descripHtml = '<p>The ' + featureName + ', ' + country + ' metro opened in ' + year + ' and currently serves ' + passengers + ' passengers a day. The network consists of ' + stations + ' stations spread over ' + length + ' kilometers.</p>';
var readmoreHtml = '<p><a href="' + link + '">Read more</a></p>';
document.getElementById('summaryLabel').innerHTML = titleHtml + descripHtml + readmoreHtml;
document.getElementById('metroImage').innerHTML = photoHtml;
L.DomEvent.stopPropagation(e); // stop click event from being propagated further
}
});
}
// define and register event handler for click events to unselect features when clicked anywhere else on the map
map.addEventListener('click', function(e) {
if (selection) {
if (selectedLayer === metroLayer) selection.setIcon(iconByPassday(selectedFeature));
selection = null;
document.getElementById('summaryLabel').innerHTML = '<p>Click a metro rail system on the map to get more information.</p>';
document.getElementById('metroImage').innerHTML = ''
}
});
}
</script>
</head>
<body onload="init()">
<div class="navbar navbar-inverse navbar-fixed-top">
<div class="navbar-inner">
<div class="container-fluid">
<a class="brand" href="/">Large metro rail systems in South America</a>
</div>
</div>
</div>
<div class="container-fluid">
<div class="row-fluid">
<div class="span5">
<div id="mapid">
</div>
</div>
<div class="span7">
<div>
<table>
<tr>
<td><img src="metro_legend.png"/></td>
<td id = 'summaryLabel'><p>Click a metro rail system on the map to get more information.</p></td>
</tr>
</table>
<div id="metroImage"></div>
</div>
</div>
</div>
</div>
</body>
</html>