Although Leaflet does not offer a point-and-click interface for building a web application, it does give you a few pre-coded "controls" that you can add to the map with just a few lines of code. These include a scale bar, layer switcher, zoom buttons, and attribution box. OpenLayers offers these same types of controls, plus a few more such as an overview map, geographic coordinates written on the page, and so on.
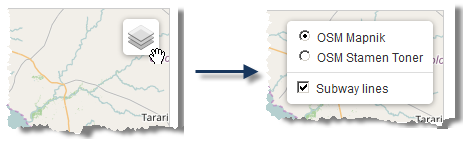
The example below shows a Leaflet layer switcher control in action. Hovering the mouse over (or tapping) the layer icon in the corner displays a layer list, where you can choose a basemap and toggle the visibility of thematic layers. This image shows the default OpenStreetMap Mapnik basemap selected, with the option to switch to the Stamen Toner basemap. You'll apply this code in your walkthrough later in the lesson. Only one thematic layer is available below, the "Subway lines" layer; however, you could include more layers here simply by adding them to the Leaflet map.
Here's how you would code the layer switcher above. First, set up all the layers and add the ones to the map that you want to have initially visible. Then, call a function that sets up two simple JavaScript objects containing your basemaps and thematic layers. Finally, create the layer switcher (L.control.layers), passing in those two JavaScript objects as parameters.
// create and add osm tile layer
var osm = L.tileLayer('http://{s}.tile.openstreetmap.org/{z}/{x}/{y}.png', {
maxZoom: 19,
attribution: '© <a href="http://www.openstreetmap.org/copyright">OpenStreetMap</a>'
});
osm.addTo(map);
// create stamen osm layer (not adding it to map)
var stamen = L.tileLayer('http://tile.stamen.com/toner/{z}/{x}/{y}.png', {
maxZoom: 19,
attribution: '© <a href="http://www.openstreetmap.org/">OpenStreetMap</a> and contributors, under an <a href="http://www.openstreetmap.org/copyright" title="ODbL">open license</a>. Toner style by <a href="http://stamen.com">Stamen Design</a>'
});
// Set up styles for subway lines
function subteStyle(feature) {
return {
"color": feature.properties.COLOR,
"weight": 5
};
}
// Create layer and add it to the map
var subteLayer = L.geoJSON(subteData, {
style: subteStyle
});
subteLayer.addTo(map);
createLayerSwitcher();
// function to create a layer switcher control
function createLayerSwitcher() {
// define basemap and thematic layers and add layer switcher control
var basemaps = {
"OSM Mapnik": osm,
"OSM Stamen Toner": stamen
};
var overlays = {
"Subway lines": subteLayer
};
L.control.layers(basemaps,overlays).addTo(map);
}
Usually control frameworks are extensible, so you may even decide to pull in controls developed by others or, if you're feeling ambitious, code your own. Although customizing the out-of-the-box Leaflet controls is beyond the scope of this course, you should be aware that controls have a stylesheet you can tweak. Also, controls with images can be customized by substituting your own image. Examining the Leaflet stylesheets and example stylesheets may help you understand which CSS properties to override when applying your customizations.
The Leaflet API reference describes the controls in the namespace L.Control. The best way to learn about controls is to experiment with them yourself and expand your functionality, bit by bit, using existing examples, documentation, and some trial and error. In other web mapping APIs, controls may be called "widgets," "plugins," or other names.