5.4 Change the Symbology from Realistic to Analytical
You have learned how to apply a rule package symbology to buildings to demonstrate a realistic view of campus. For some types of 3D analysis, an analytical demonstration may suffice. For the next Module, you will need an analytical presentation of campus. In this section, you will learn how to switch from realistic to analytical. In the next lesson, you will learn examples of 3D spatial analysis and you will need these analytical 3D models for the analysis.
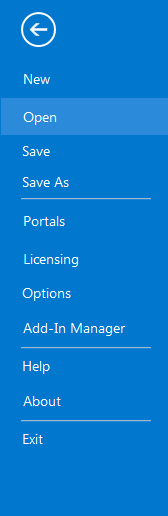
- Click the Project tab. Select Save As.
 Credit: 2016, ArcGIS
 - In the Projects Folder (C:\Users\YOURUSER\Documents\ArcGIS\Projects\UniversityParkCampus), Save Project as UniversityParkCampus_Lesson6. This way you will create a new project for the next lesson.
- Go back to the Map view.
- Uncheck the CE_trees_Realistic.
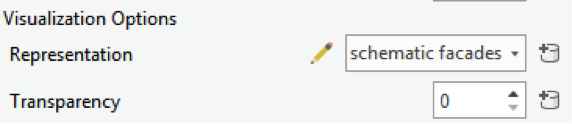
- Click on symbology under UP_Roof_Segments. On the Symbology pane, click Properties and select Layers.
- Change representation from realistic with façade textures to schematic facades.
Click apply.
 Credit: 2016, ArcGIS
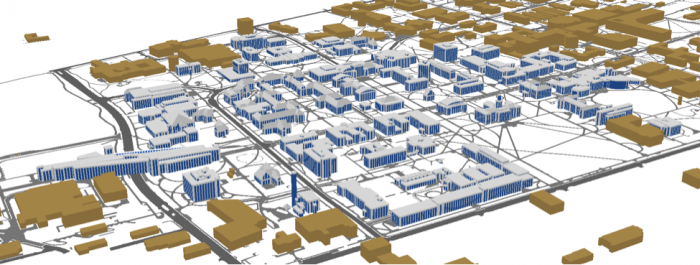
 - Your campus model should look like the following image:
 Credit: ChoroPhronesis
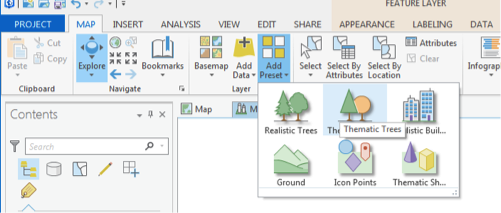
 - Now, you will add thematic trees. On Map tab click Add Preset and select thematic trees.
 Credit: 2016, ArcGIS
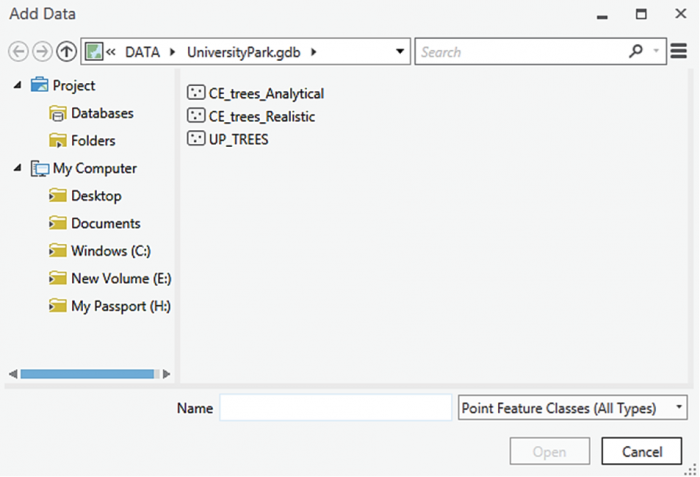
 - From the Geodatabase that you have downloaded, select CE_trees_Analytical. Click Select.
 Credit: 2016, ArcGIS
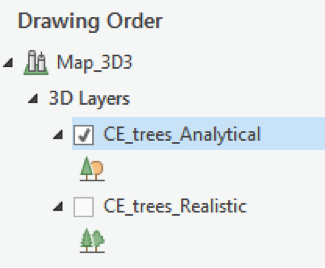
 - The layer will be added to your 3Dlayers list.
 Credit: 2016, ArcGIS
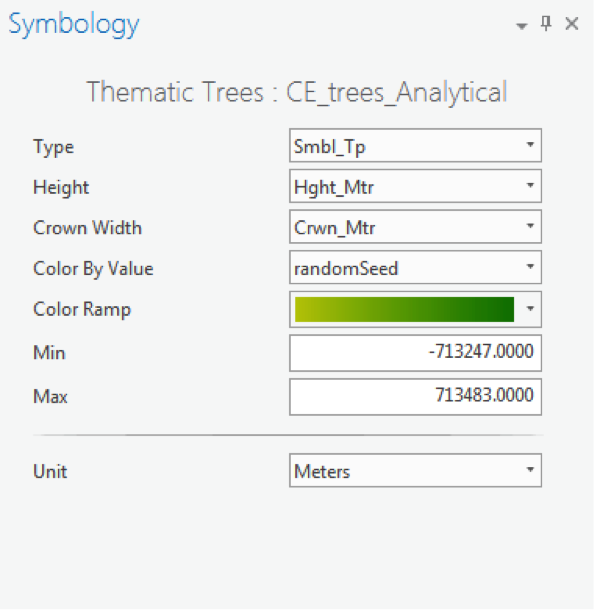
 - As you see in the map, the scale of trees is not right. Click on the symbol under the layer to modify it. Change the parameters as shown below.
As you see, one of the factors is color by value. Select random Seed and the green color ramp. This will give your trees a more colorful presentation.
 Credit: 2016, ArcGIS
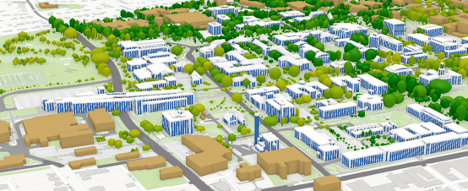 Credit: ChoroPhronesis
 - Create a PDF map (like the end of Section 3) or take a screenshot of your UP Campus schematic 3D model for your graded assignment. This is Task 4 on the Tasks and Deliverables page.
- Save the project.
In this lesson, you learned how to work with ArcGIS Pro from creating a map and symbolizing layers to exploring raster and 3D data. You also learned about symbolizing 3D layers with rule packages from CityEngine. In the next lesson, you will learn about some 3D analysis that is possible with 3D data.