Prioritize...
When you have completed this section, you should be able to recognize common quasi-periodic patterns in a dataset.
Read...
There are two general groups of patterns: periodic and trend. Periodic is a pattern that repeats at a regular timescale. We can break periodic down into quasi-periodic (roughly predictable across many cycles) and chaotic (predictable for only a cycle or so). You should note that trends and periodicity can and do occur in the same time series, which can make it difficult to detect and or differentiate the two patterns. For now, we are going to focus on some quasi-periodic patterns that are quite common in many datasets you will use for weather and climate analytics.
Diurnal
Some variables exhibit a daily pattern, i.e., they change systematically from night to day. These patterns are called diurnal and are the shortest time scales we will discuss. Specifically, think about temperature. At night, the temperature is generally cooler, while during the day it is warmer. This pattern is diurnal and can be seen if you plot hourly temperatures for multiple days.
Let’s check this out. Here are some hourly temperature data from Chicago, IL during the month of August 2010. Open the file and extract the temperature out using the code below.
Your script should look something like this:
# load in data
mydata <- read.csv("hourly_temp_chicago.csv")

# extract out date and temperature
dtimes <-paste0(substr(mydata$DATE,1,4),"-",substr(mydata$DATE,5,6),"-",substr(mydata$DATE,7,8),
               " ",substr(mydata$DATE,10,11),":",00,":",00)
dtparts = t(as.data.frame(strsplit(dtimes,' ')))
thetimes = chron(dates=dtparts[,1],times=dtparts[,2],format=c('y-m-d','h:m:s'))

hourlyTemp <- mydata$HLY.TEMP.NORMAL
Now, let’s plot the hourly temperature for 3 days.
Your script should look something like this:
# plot hourly temperatures
grid(col="gray")
par(new=TRUE)
plot(thetimes[1:72],hourlyTemp[1:72],xlab="Time",
     ylab="Temperature (Degress F)",
     main="Chicago, IL Hourly Temperature",
     xaxt='n',type="l",lty=1)
axis.Date(1,thetimes[1:72],format="%Y%m%d")
You should get a figure like this:

You can see the continuous pattern over the three-day period, where the temperature reaches a maximum during the day and a minimum at night. This is a prime example of a diurnal cycle and falls under the quasi-periodic category.
Annual
Similar to the diurnal pattern, an annual pattern, especially in temperature, can be observed. In the Northern Hemisphere during the months of June, July, and August (summer), temperatures are warmer than in the months of December, January, February (winter). If you were to plot monthly temperatures, you would see this peak in summer and dip in winter. This is quasi-periodic because we can rely on this pattern to continuously occur for many cycles - meaning, every year we expect the temperatures to be warmer in summer and cooler in winter for the Northern Hemisphere.
Let’s test this out. Load in the monthly temperatures for Chicago, IL.
Your script should look something like this:
# load in data
mydata <- read.csv("monthly_temp_chicago.csv")

# extract out date and temperature
DATE<-as.Date(paste0(substr(mydata$DATE,1,4)
                     ,"-",
                     substr(mydata$DATE,6,7),"-","1"))
monthlyTemp <-mydata$TAVG
Now, plot the monthly temperatures over three years, and see if there is a repeating pattern.
Your script should look something like this:
# plot monthly temperatures
grid(col="gray")
par(new=TRUE)
plot(DATE,monthlyTemp,xlab="Date",ylab="Temperature (Degress F)",
     main="Chicago, IL Monthly Temperature",xaxt='n',type="l",lty=1)
axis.Date(1,DATE,format="%Y%m")
You should get a figure like this:
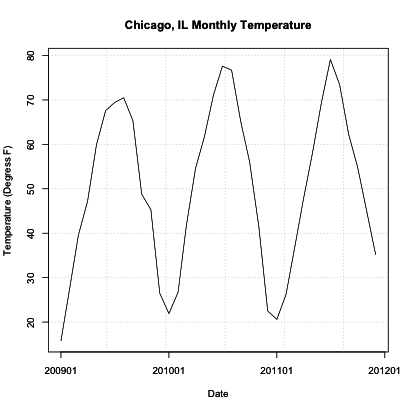
Similar to the diurnal example, we see a repeating pattern of warm and cool temperatures. In this case, though, we see very cold temperatures during the Northern Hemisphere winter months and warm temperatures during the Northern Hemisphere summer months. Although they are not constantly the same low monthly temperature, this pattern is quite visible and is to be expected each year (quasi-periodic).
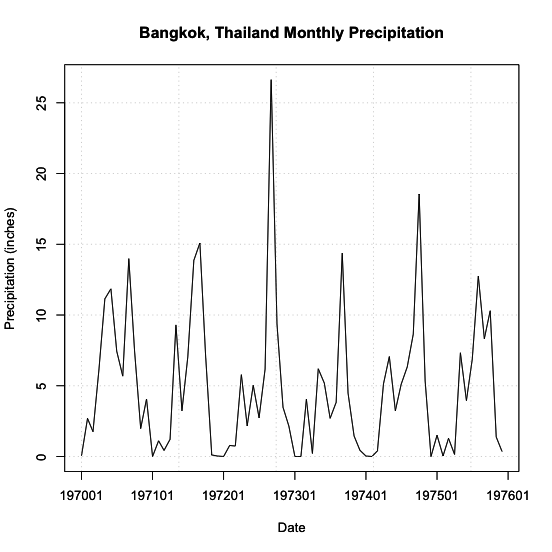
In certain geographical regions, splitting up the year by the common seasons we are used to in the United States is not appropriate. Instead, we split the year up between wet and dry season. Sometimes called the monsoon season, this is another example of an annual cycle. This cycle, however, is characterized by periods of rain and periods of dry and is quite prominent in the Tropics.
Again, let’s test this out. We are going to plot monthly precipitation for Bangkok, Thailand. Start by loading in the data and extracting out the time and precipitation variables.
Your script should look something like this:
# load in data
mydata <- read.csv("monthly_precip_bangkok.csv")

# extract out date and temperature
DATE<-as.Date(paste0(substr(mydata$DATE,1,4),"-",substr(mydata$DATE,6,7),"-","1"))
monthlyPrecip <-mydata$PRCP
Now, let’s plot the first 6 years of data.
Your script should look something like this:
# plot monthly precipitation
grid(col="gray")
par(new=TRUE)
plot(DATE[1:72],monthlyPrecip[1:72],xlab="Date",
     ylab="Precipitation (inches)",
     main="Bangkok, Thailand Monthly Precipitation",
     xaxt='n',type="l",lty=1)
axis.Date(1,DATE[1:72],format="%Y%m")
You should get a figure similar to this: