"Planet" in the CSR
The White Whale of Sustainability Reporting
There are hundreds, if not thousands, of Planet elements that could be addressed in a CSR, from solvent emissions to carbon emissions to chain of custody reporting, and it would appear that some organizations indeed feel compelled to address every single one. So, the CSR and sustainability program attempts to do everything, acquire every certification, address every standard... and in the process, does not actually progress toward any meaningful goal. For this reason, one might consider this overscoped organizational approach to Planet as pursuing some mythical "White Whale of Sustainability Reporting," as it represents a relentless, yet futile, chase on the part of the sustainability program.
If we try to understand the motivations of these organizations chasing the "White Whale," the underlying root cause may ultimately be a sustainability program weak in VISAS facets. Instead of concentrating on those Planet elements and metrics which are of high importance for their own sustainability vision, the tendency can be to "fill the void." Because the sustainability program lacks direction, purpose, and personality, it does what is easy and superficial... and it does so through a high volume of essentially meaningless activities. As we will see throughout the semester, effective sustainability programs are just as much about saying "yes" as they are about saying "no." We must make choices about what is important to the organization as we develop a platform for innovation.
For your consideration
BMW Group has more than 110,000 employees worldwide, around € 75 billion in annual revenue... and is arguably one of the most sustainable companies in the world.
It has three environmental Key Performance Indicators (KPI): (1) Energy consumption per vehicle produced, (2) Waste for disposal per vehicle produced, and (3) Water consumption per vehicle produced. It then adds three more measurements to create the core of its "group-wide environmental protection" program: Process wastewater, Solvent emissions, and CO2 emissions.
If BMW can focus on only SIX top-level environmental metrics most important to its vision, perhaps this is a worthy aspiration for any organization. BMW has said "no" to a tremendous number of potential distractions to be able to say "yes" and devote appropriate attention to those six measurements.
Planet aspects and indicators in sustainability reporting
A note on terminology we will be using quite a bit in this course and in reference in CSRs:
Environmental aspect: Any means by which the organization directly or indirectly impacts the environment through the manufacture, transportation, use, or end of life. This could be anything from emissions from trucks idling at a loading dock to landfilled waste.
Indicator: A measurement of the extent to which an aspect impacts the environment, such as '50 tons of CO2 generated per month 'or '450 gallons of hazardous waste generated per year.'
While there may be a seemingly infinite number of Planet aspects and indicators one could report in a CSR, there tends to be some level of uniformity on the generally most important aspect areas. Note that, while there may be best practices, there are no "required" units or means to state indicators in CSRs, even GRI-compliant ones. So, if you were compiling a CSR, you could choose to represent your energy consumption in BTU, joules, gigajoules, kWh... and potentially also index it to whatever baseline or other number you prefer. So, even if two companies state internal energy consumption in gigajoules, one could index to production ("gigajoules of energy consumed per 1000 cars produced"), while the other could index to a baseline ("gigajoules of energy consumed, compared to 2009 baseline"). So even if the aspect and core indicator are the same, they could be stated in drastically different ways.
In the table below are some expressions of the more common Environmental/Planet aspects you'll see in CSRs worldwide. I have also included links to the Global Reporting Initiative G4 Implementation Manual for reference (or if you would like to explore more on a certain aspect!).
Read the linked GRI pages (a page or two each), and pay special attention to the Guidance: Relevance sections, as they frame up the topic nicely.
Review the sample presentations of the indicators. Take some time to consider not only the structure of the presentation, but also the underlying aspects and indicators represented.
- Are they are appropriately represented for the organization?
- Are they clearly stated?
- Could they be better stated in a different way?
As we become more advanced in our abilities to critically analyze filings, we will begin to see that although some indicators and graphs may appear to be beautifully executed, there may be serious issues underlying the scope and indexing on which the indicator is represented.
As a warm-up, I have included two graphs with elements we could consider "red flags" and deserving of some additional research and scrutiny. Again, these are all superficially well-structured, attractive presentations of the indicators, but they may hide significant flaws in logic or measurement. Give it a try, and see if you can identify the two "red flags" in the presentations below!
Planet Aspects and Indicators in Corporate Sustainability Reports
Greenhouse Gas Emissions (GHG)
| Aspect of Greenhouse Gas Emissions (GHG) | GRI G4 definition | Example/Presentation of the indicator as presented in CSR |
|---|---|---|
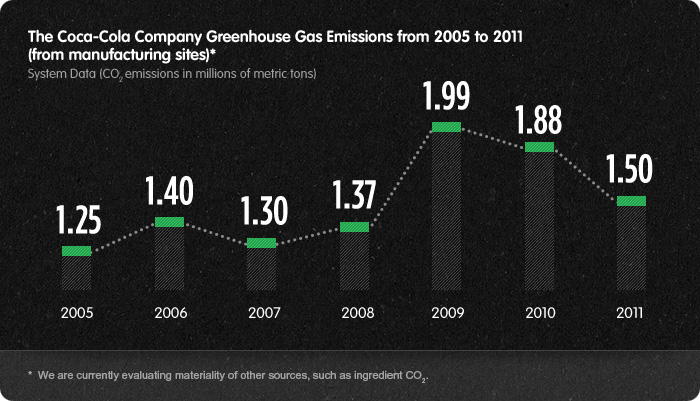
| Scope 1 emissions | G4-EN15 Report |
Text Version for Coca-Cola Company Greenhouse Gas Emissions from 2005 - 2011 |
| Scope 2 emissions | G4-EN16 Report | 
Credit: enter credit here
Click on image to see a larger version.Text Version of the CH2M HILL Global Carbon Emissions Image |
| Scope 3 emissions | G4-EN17 Report | 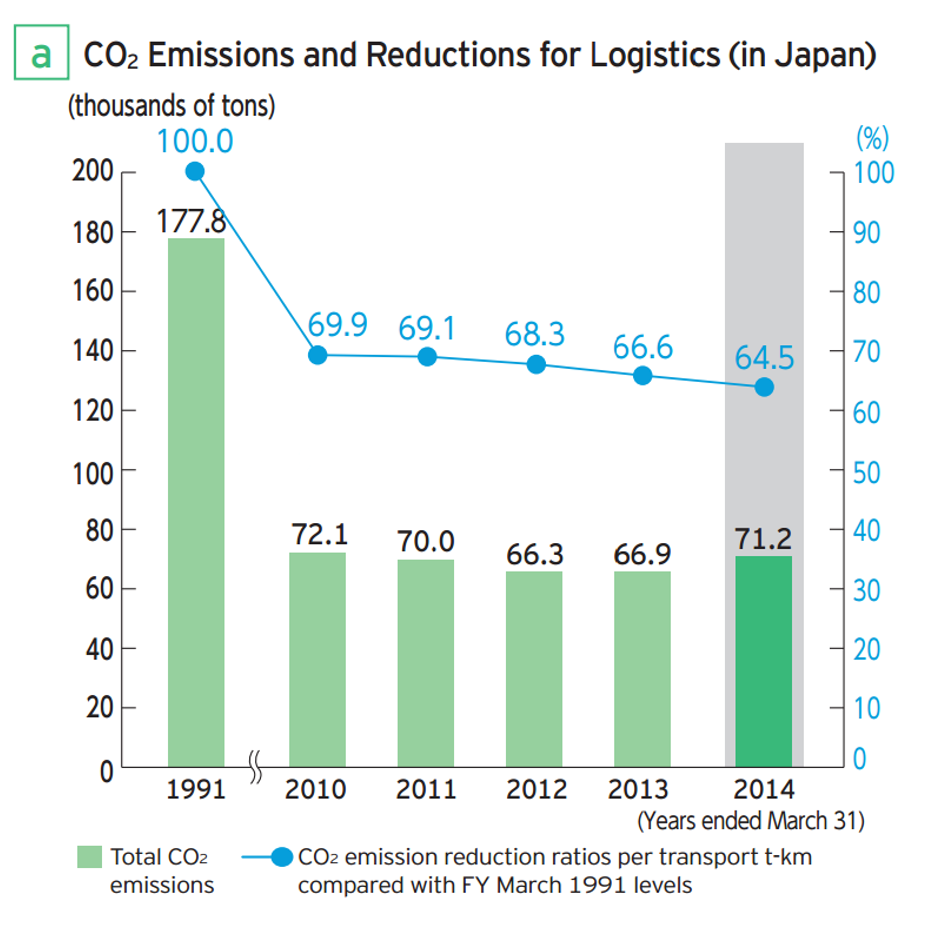
Credit: enter credit here
Click on image to see a larger version.Text Version of CO2 Emissions and Reductions for Logistics (in Japan) |
Solvent and Vapor Emissions
| Aspect of Solvent and Vapor Emissions | GRI G4 definition | Example/Presentation of the indicator as presented in CSR |
|---|---|---|
| Volatile Organic Compounds | G4-EN21 Report | 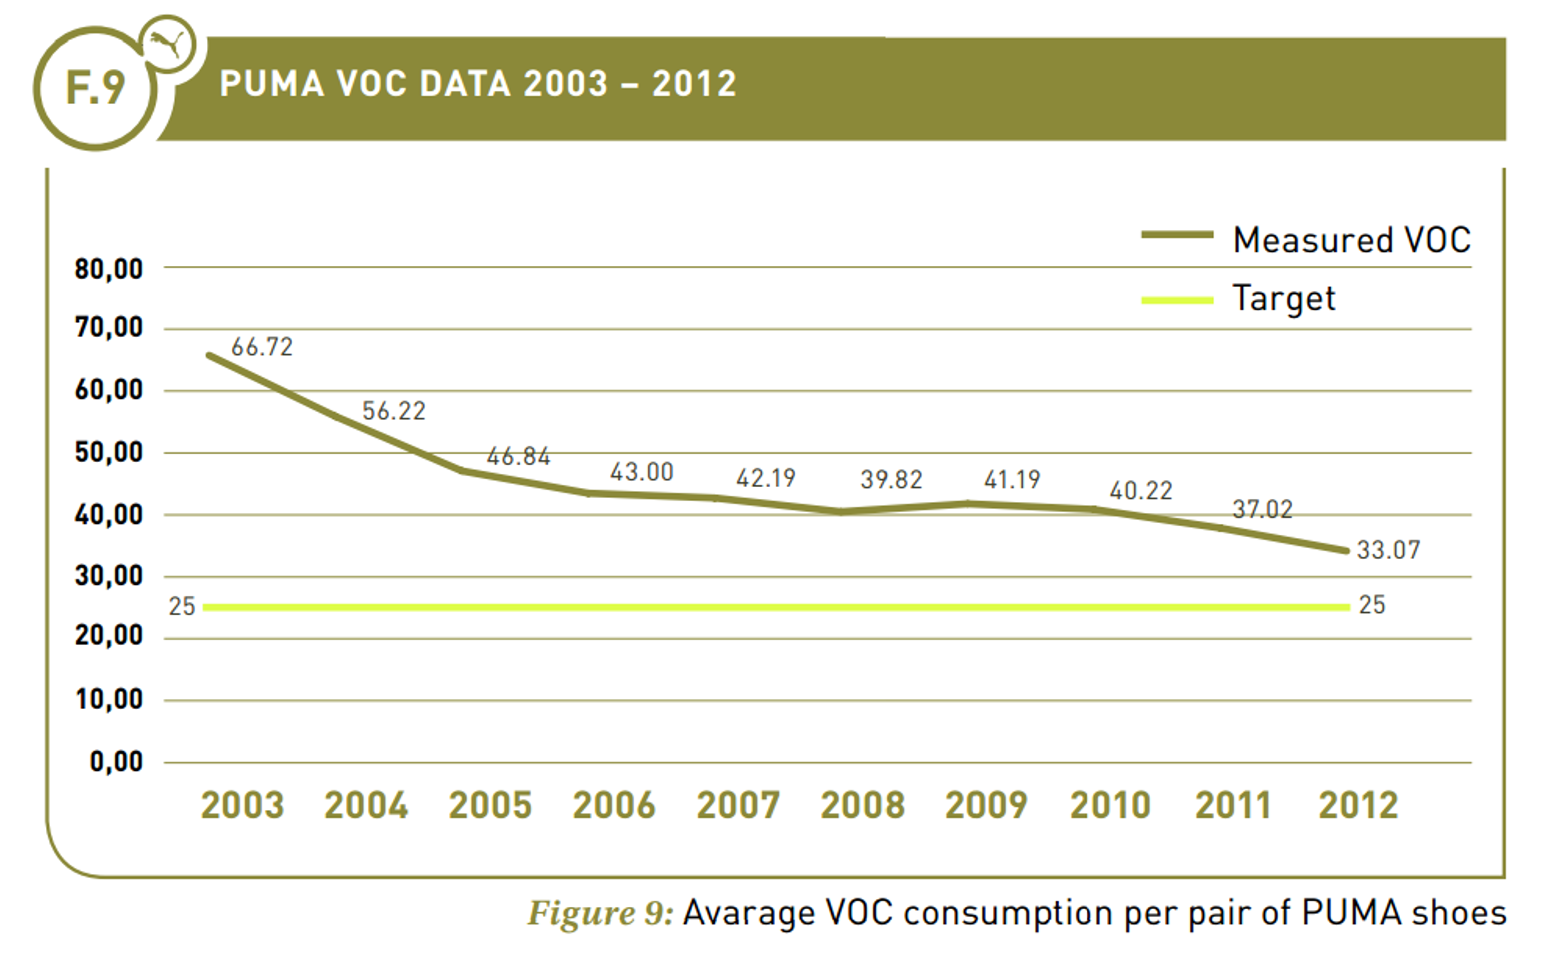
Credit: enter credit here
Click on image above to see a larger version.Text Version of PUMA VOC Data 2003-2012 Graph |
Waste and Byproducts
| Aspect of Waste and Byproducts | GRI G4 definition | Example/Presentation of the indicator as presented in CSR |
|---|---|---|
|
Waste to Landfill Waste to Energy Waste Recycled |
G4-EN23 Report | 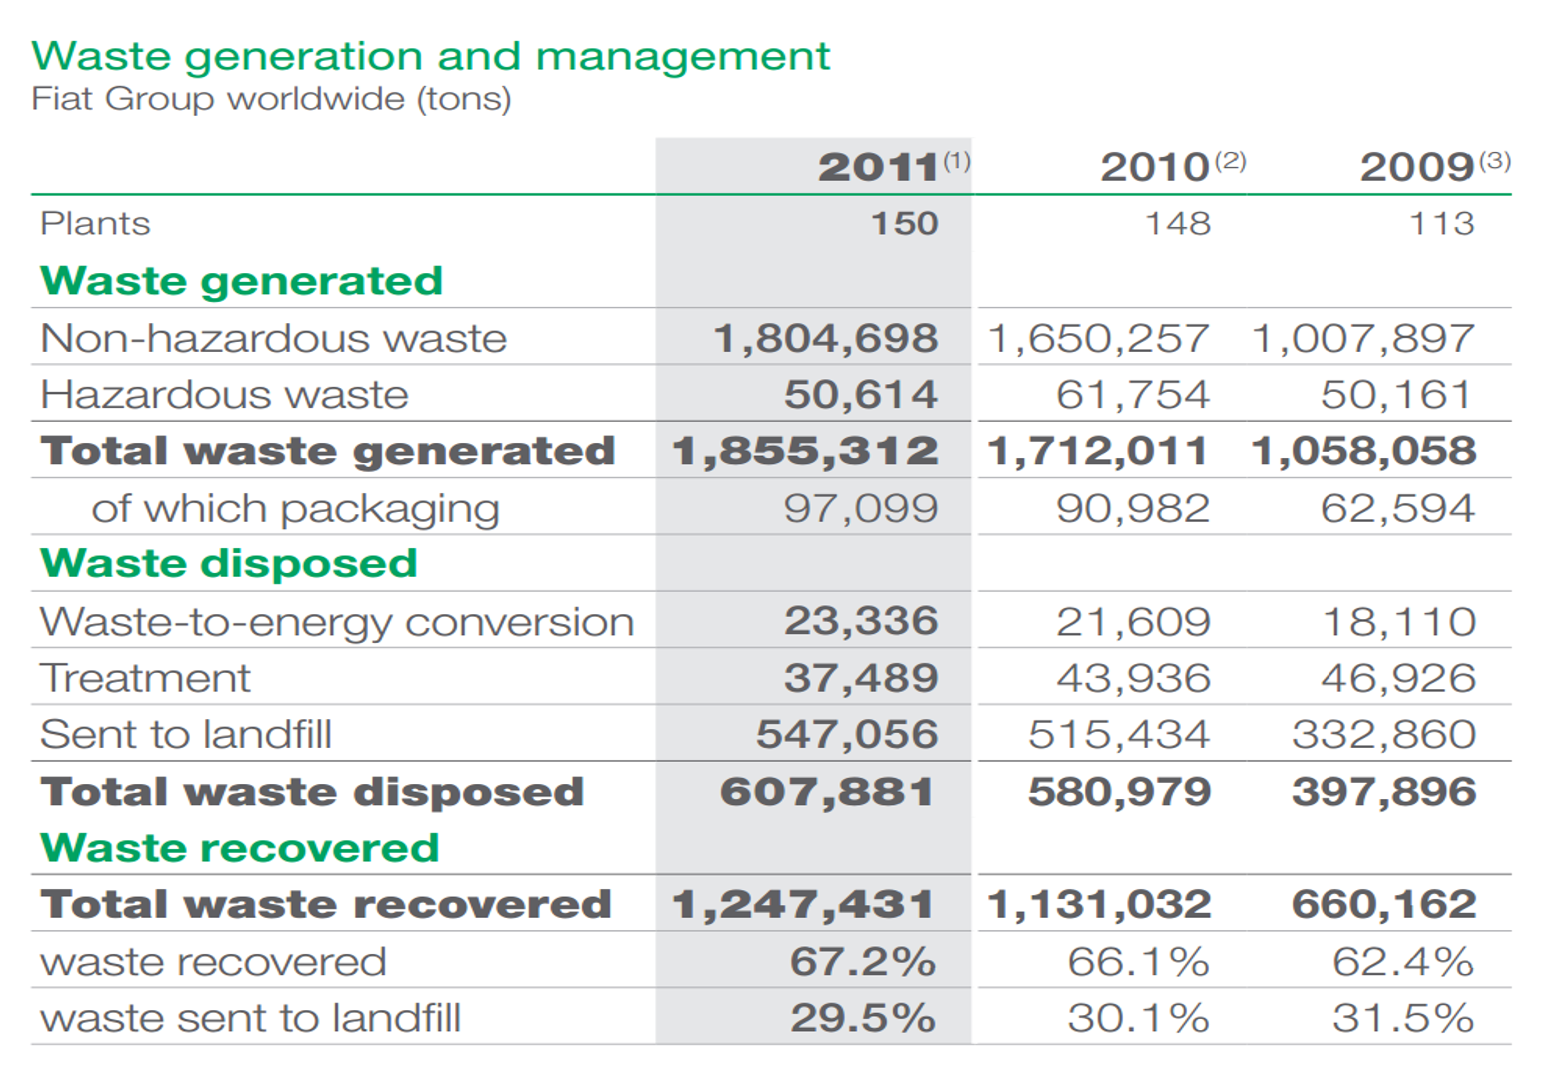
Credit: enter credit here
Click on image to see a larger version.Text Version of Waste Generation and Management Image |
| Significant spills or releases | G4-EN24 Report | 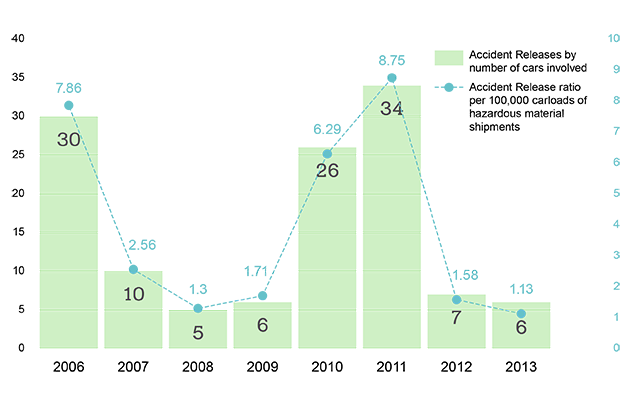
Credit: enter credit here
Click on image to see a larger version.Text Version of Significant Spills or Releases |
| Hazardous waste generation | G4-EN25 Report | 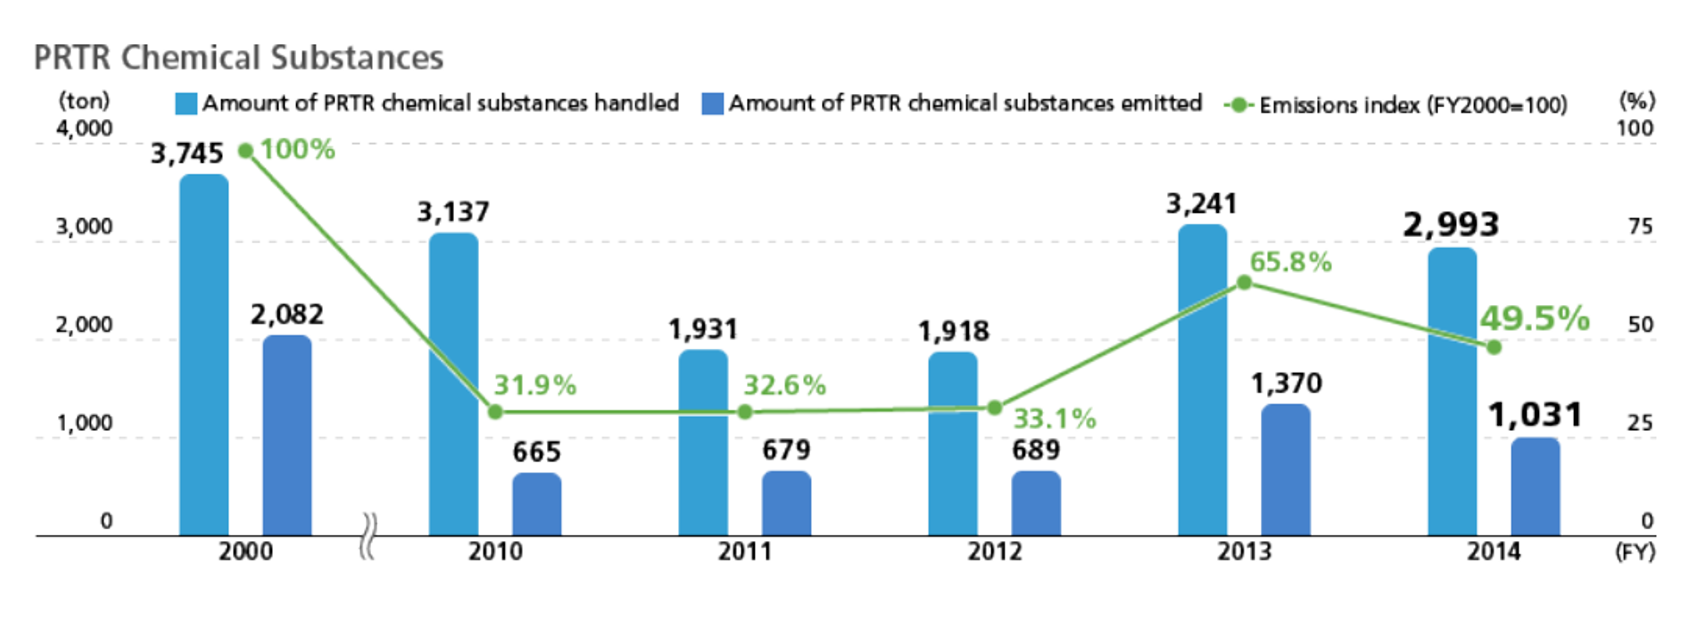
Credit: enter credit here
Click on image to see a larger version.Text Version of PRTR Chemical Substances Graph |
Energy Use
| Aspect of Energy Use | GRI G4 Definition | Example of the indicator as presented in CSR |
|---|---|---|
| Types of energy used | G4-EN3 Report | 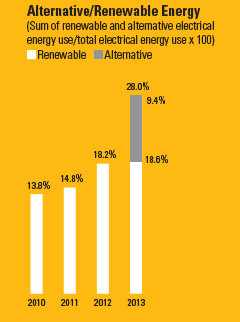
Credit: enter credit here
Text Version of Alternative/Renewable Energy Graphic |
| Energy consumption (internal, direct) | G4-EN3 Report | 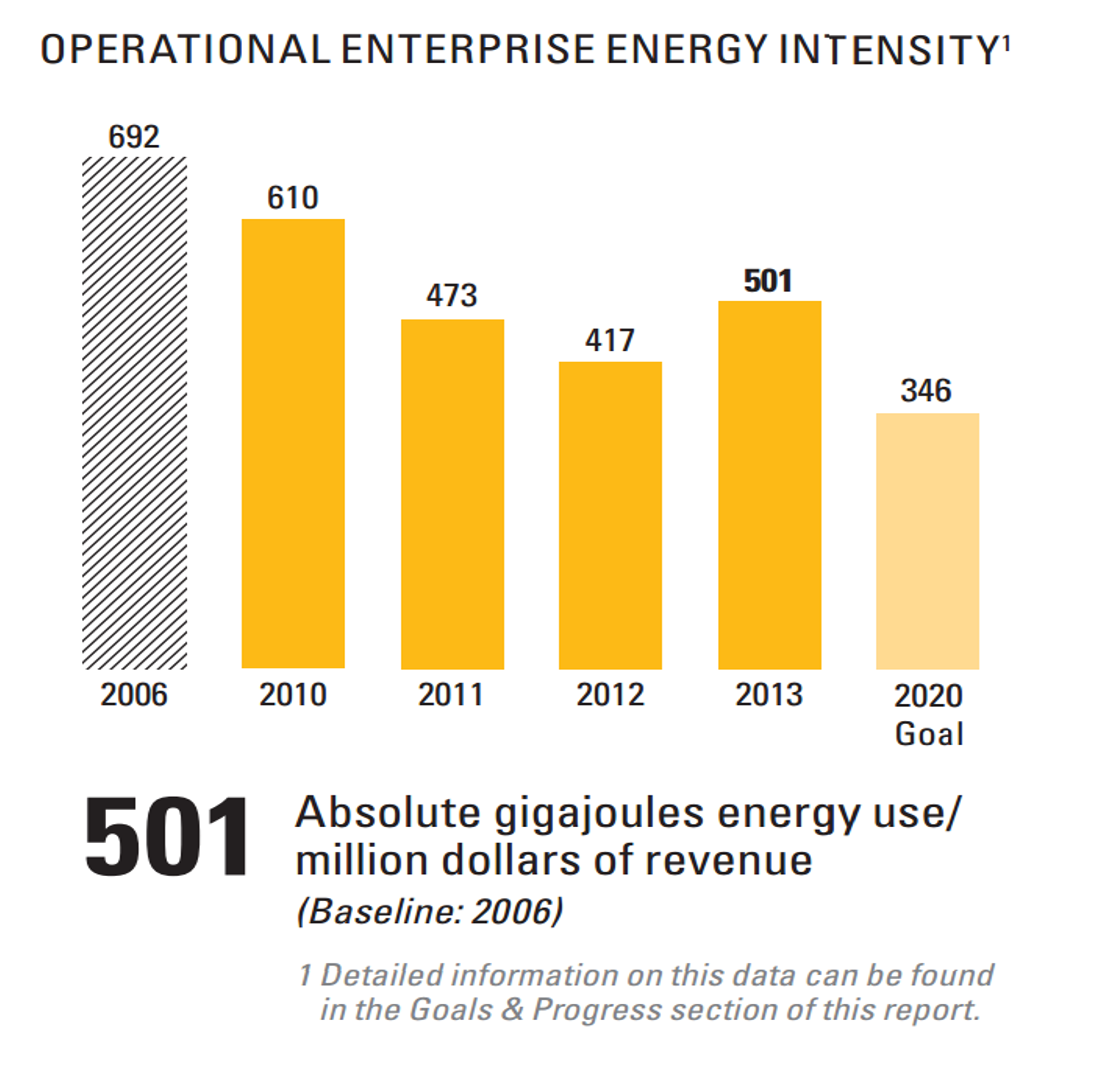
Credit: enter credit here
Click on image to see a larger version.Text Version of Operational Enterprise Energy Intensity Graphic |
| Energy consumption (indirect, supply chain) | G4-EN4 Report | 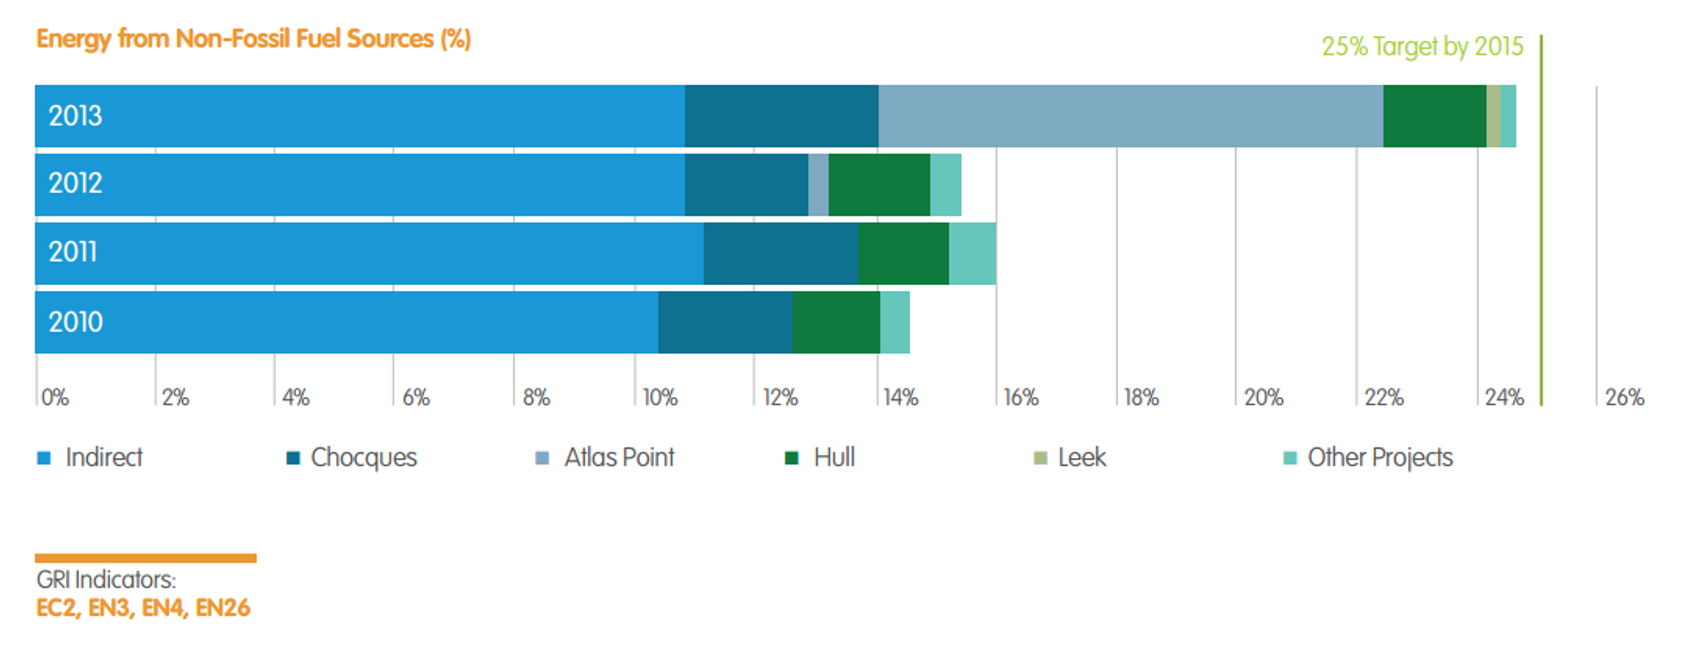
Credit: enter credit here
Click on image to see a larger version.Text Version of the Energy from Non-Fossil Fuel Sources Graph |
Water Use
| Aspect of Water Use | GRI G4 definition | Example of the indicator as presented in CSR |
|---|---|---|
| Water withdrawal and source | G4-EN8 Report | 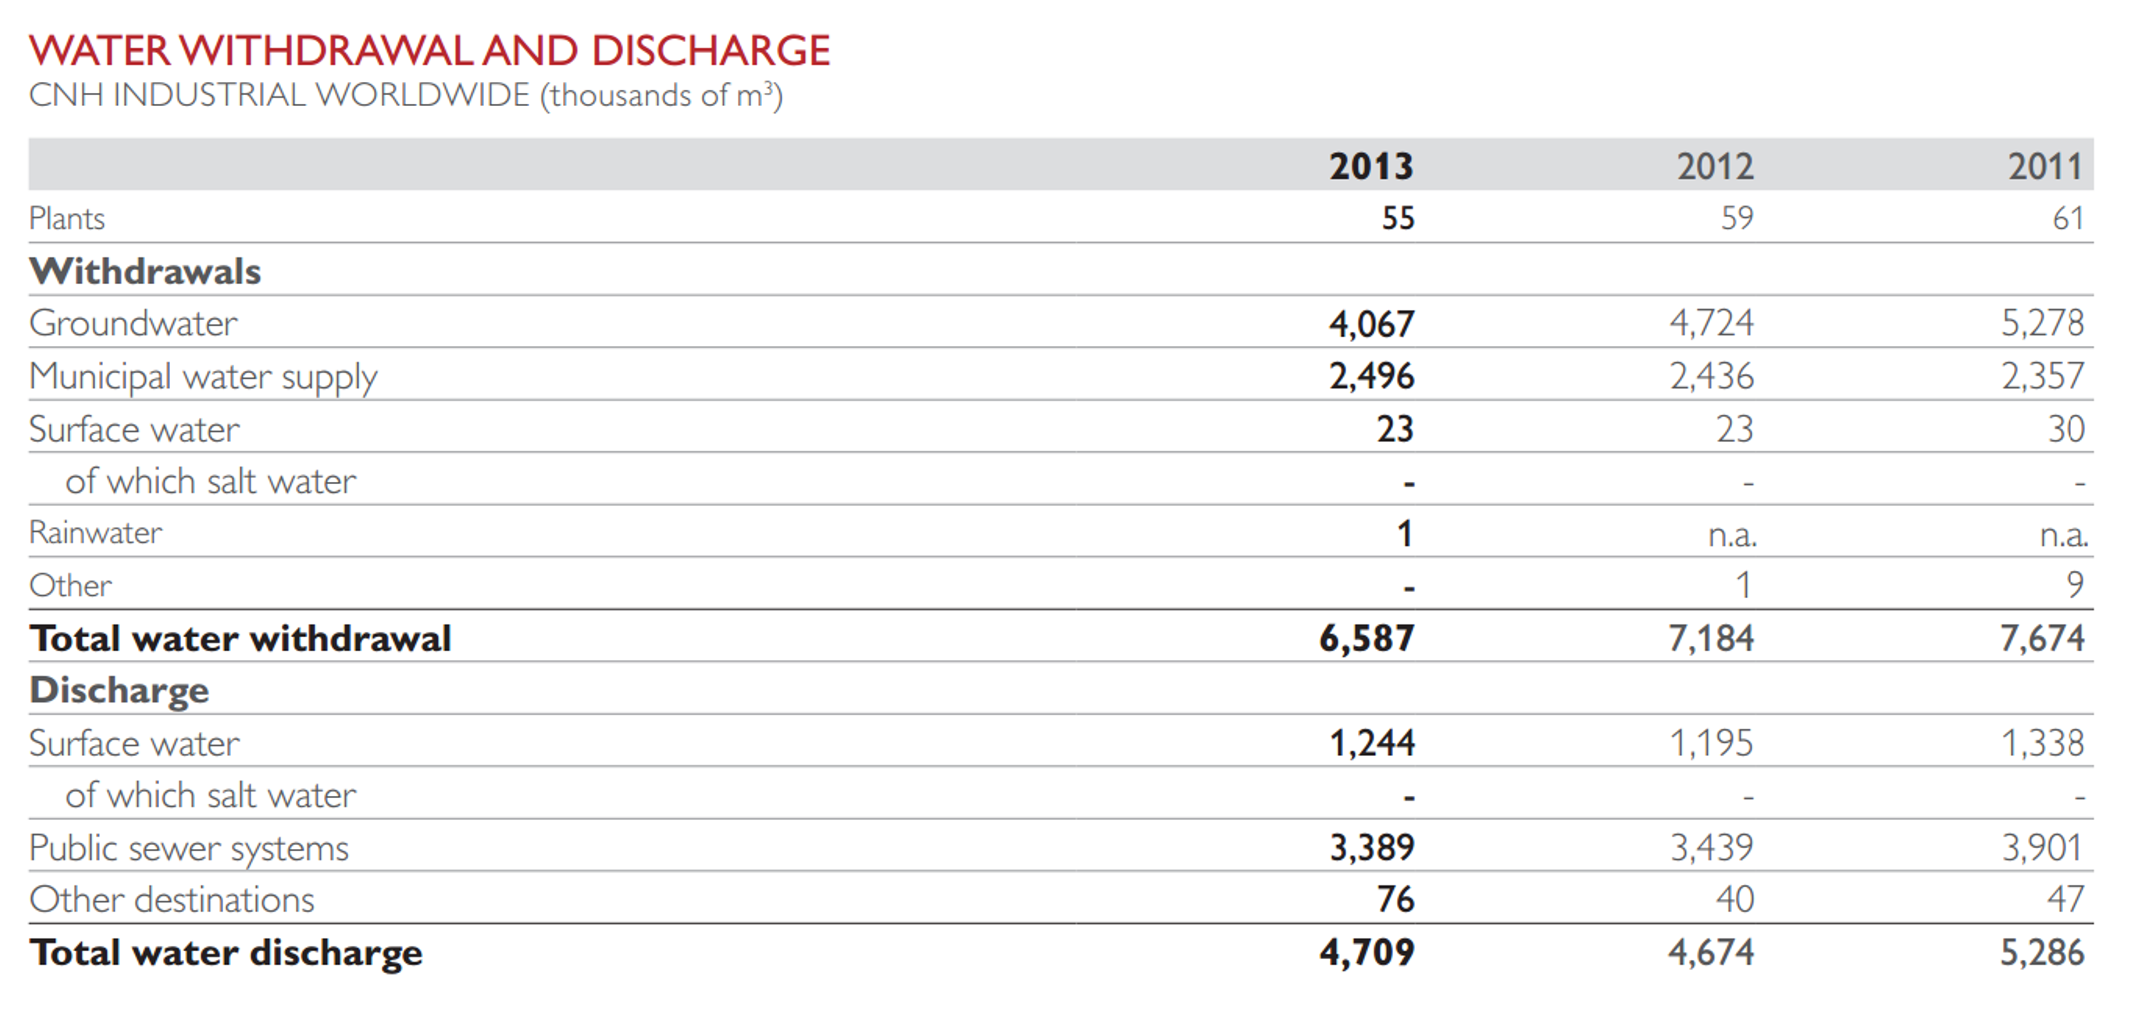
Credit: enter credit here
Click on image to see a larger version.Text Version of Water Withdrawal and Discharge |
| Water discharge quality | G4-EN22 Report |
Biodiversity and Habitat
| Aspect of Biodiversity and Habitat | GRI G4 definition | Example of the indicator as presented in CSR |
|---|---|---|
| Impacts on high value areas | G4-EN12 Report | 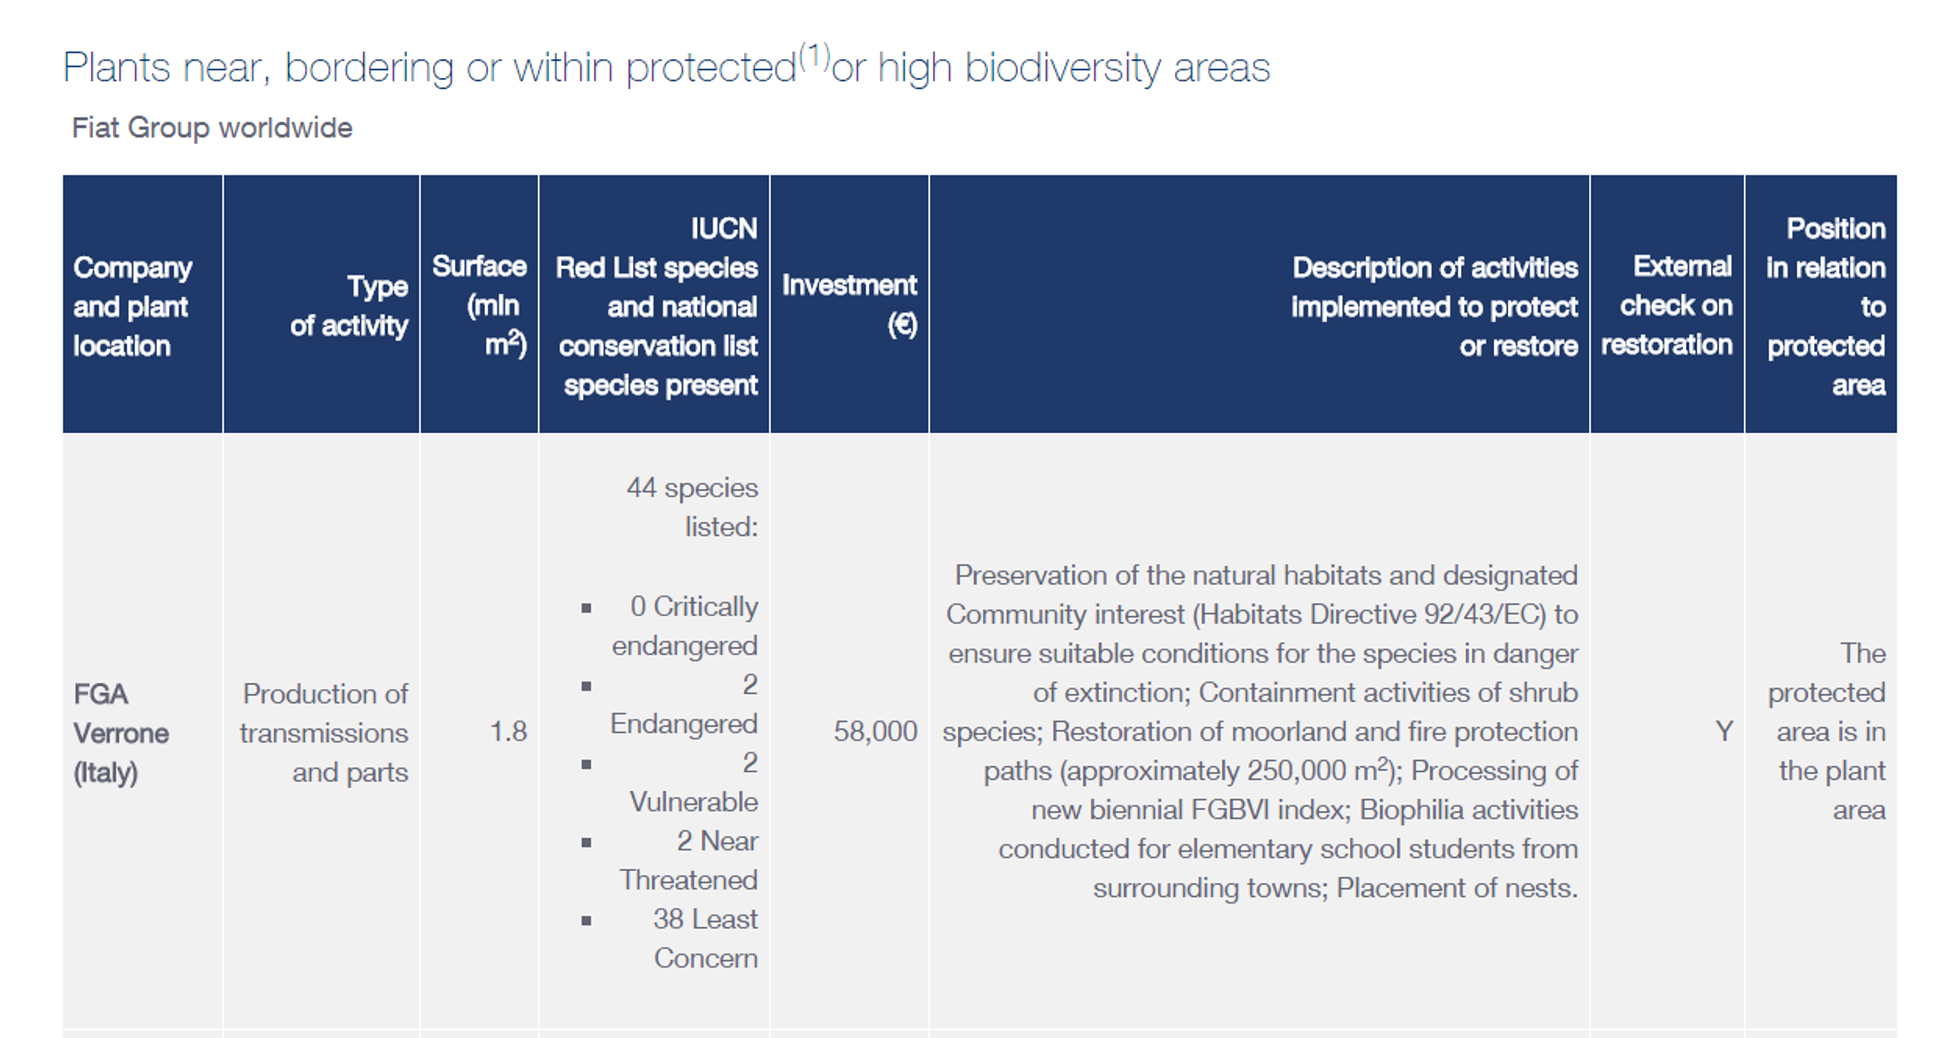
Credit: enter credit here
Click on image to see a larger version.Text Version of Plants near, bordering or within protected or high biodiversity areas |
| Habitat restoration/reclamation | G4-EN13 Report |
Design for Sustainability
| Aspect of Design for Sustainability | GRI G4 definition | Example of the indicator as presented in CSR |
|---|---|---|
| Recycled inputs | G4-EN2 Report | 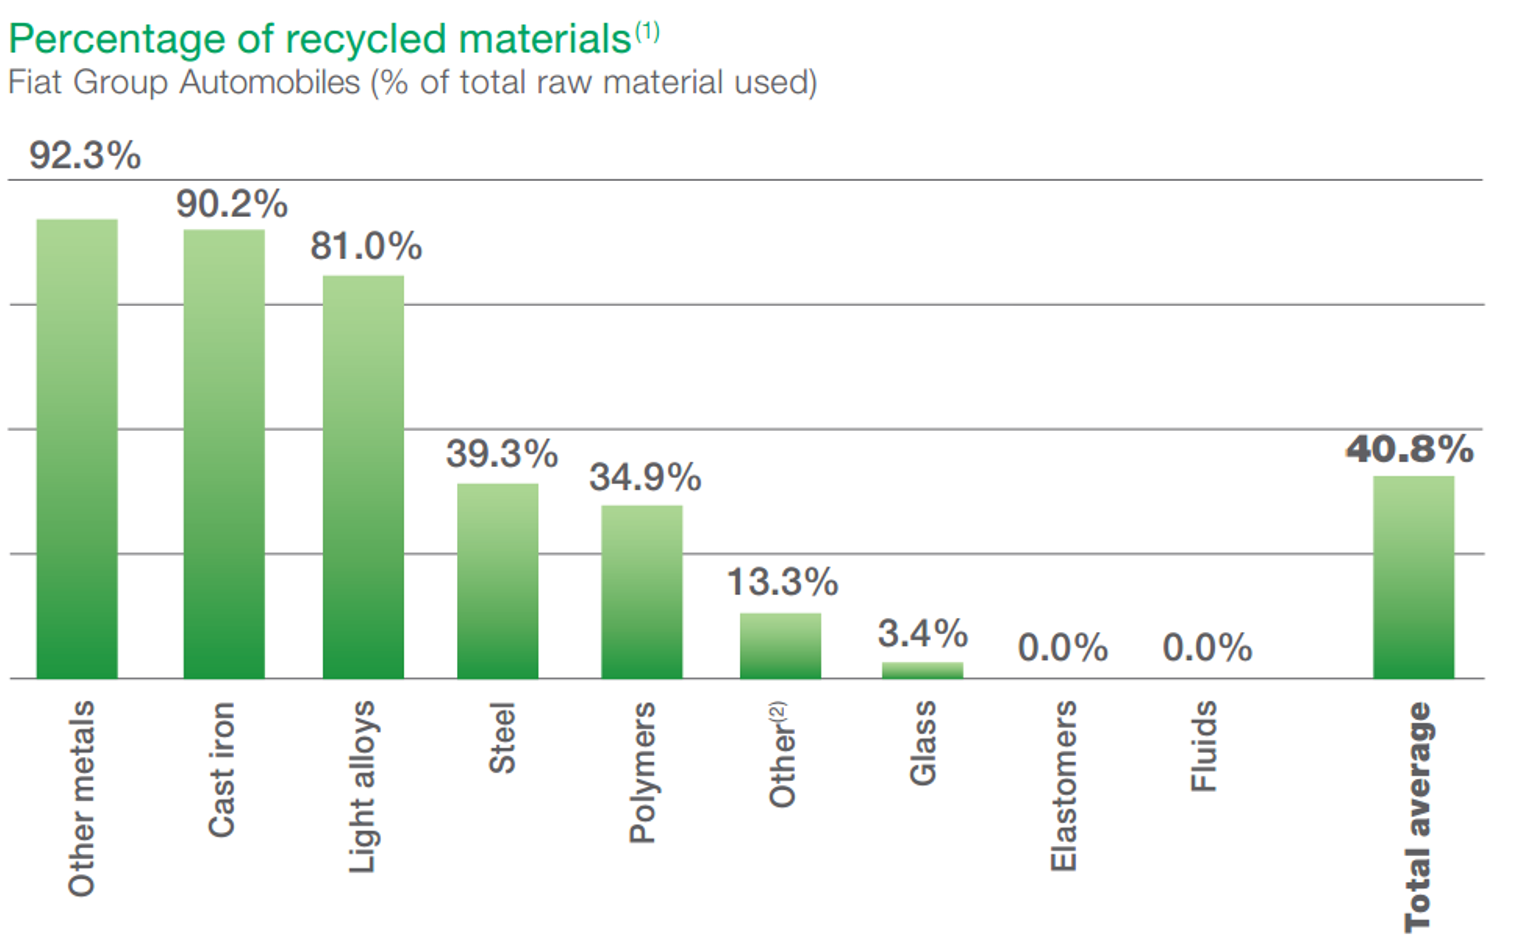
Credit: enter credit here
Click on image to see a larger version.Text Version of Percentage of Recycled Materials Graph |
| Material selection and sourcing | G4-EN1 Report | 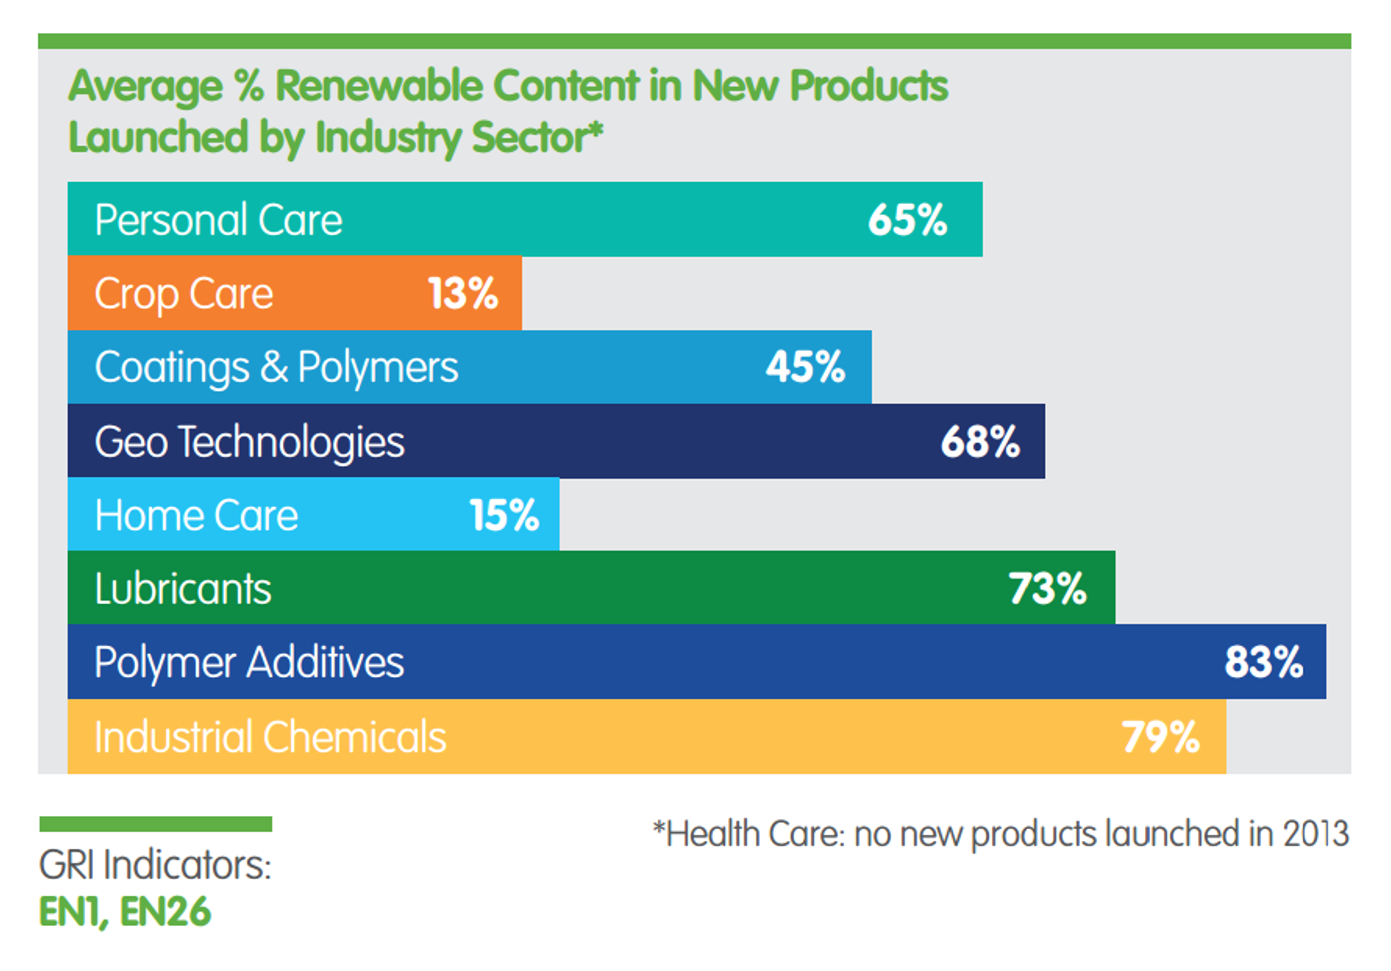
Credit: enter credit here
Click on image to see a larger version.Text Version of Average % Renewable Content in New Products Graphic |
Lifecycle Analysis/Mapping
| Aspect of Lifecycle Analysis/Mapping | GRI G4 definition | Example of the indicator as presented in CSR |
|---|---|---|
| Lifecycle impacts | G4-EN27 Report | 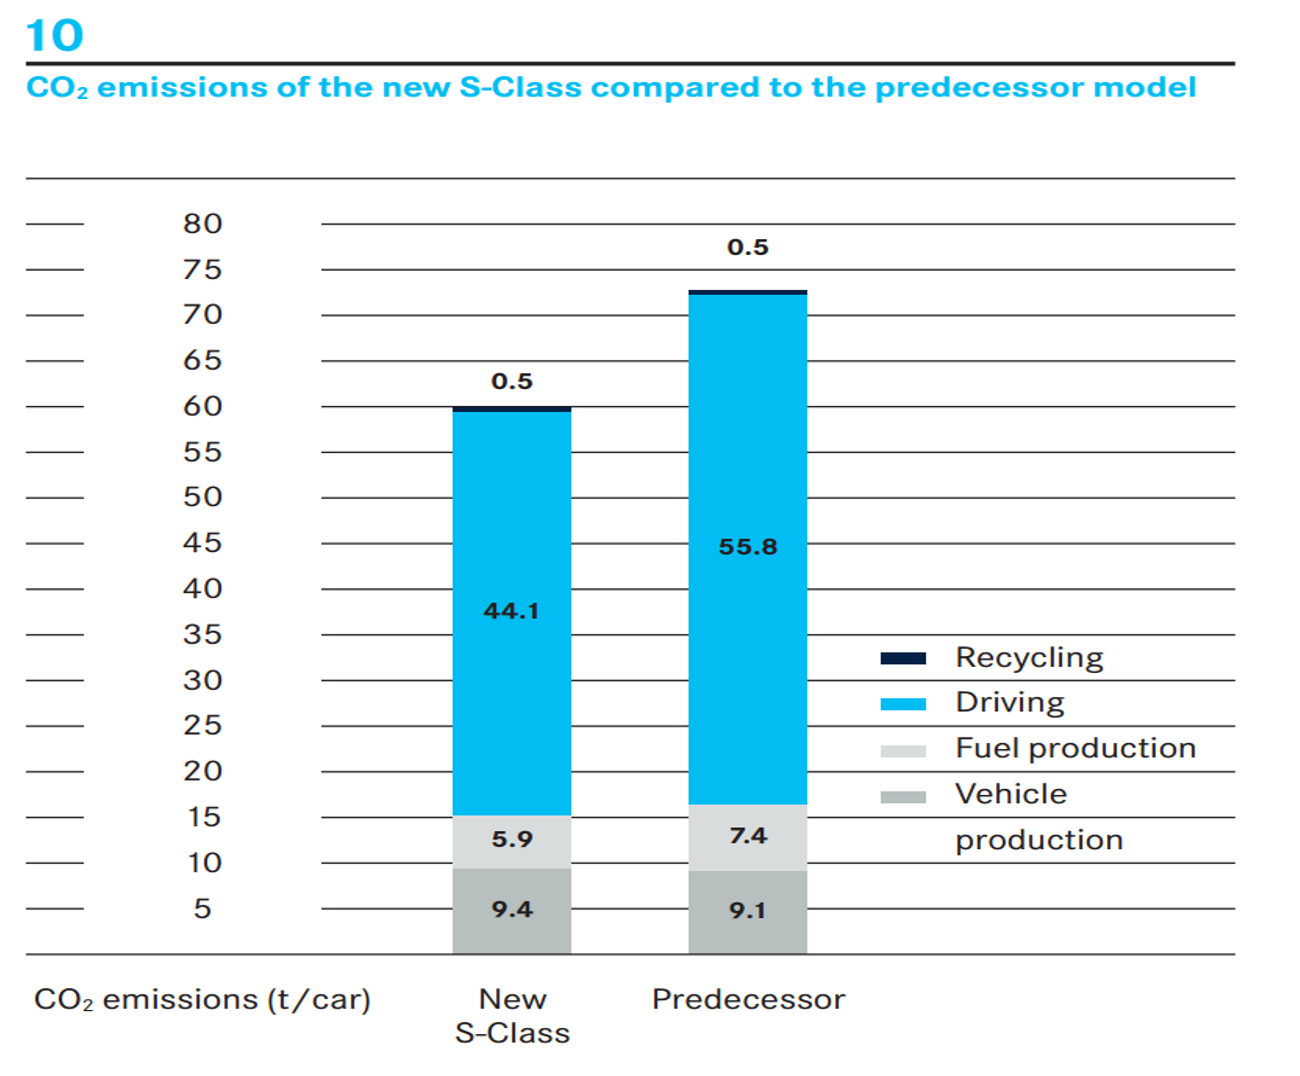
Credit: enter credit here
Click on image to see a larger version.Text Version of CO2 Emissions of the New S-Class Compared to the Predecessor Model |
| End of Life (EOL) | G4-EN28 Report | 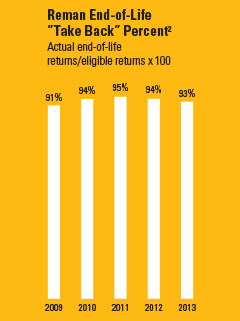
Credit: enter credit here
Text Version of Reman End-of-Life "Take Back" Percent Graphic |