Now let's take a look at some predictions of future climate based on global climate models. Recall from Elizabeth Kolbert's article that there are several groups around the world in the business of producing, running, and tweaking global climate models. Each one is slightly different in the way it treats various Earth properties. For example, some climate models do a more extensive job of modeling the oceans, and others do a more extensive job of modeling atmospheric conditions, etc. Different climate predictions result from different initial conditions, different parameterizations of interactions between systems, and different assumptions about emissions into the future.
Climate scientists are often frustrated by the portrayal of different results as "scientists don't even agree on global climate change, so how are regular people supposed to know what's happening?" In fact, climate scientists do not disagree with the basic tenets of climate change. The fact that different global climate models output somewhat different results gives scientists better insight into the sensitivities of the models. All climate models that are part of the IPCC reports agree that the Earth's average temperature has increased since the Industrial Revolution. The exact details of how much warming, how that warming has been parceled out between reservoirs, and how much warming will continue into the future is debated among groups. It is statistically quite improbable that every group would be wrong and wrong in the same direction.
Recently, a survey was given to over 10,000 earth scientists to find out whether they thought that average global temperature has increased over the last two hundred years and whether human activities caused it. The results were that 90% think that global temperature has increased and 82% thought it was because of human activities (Doran and Kendall-Zimmerman, 2009). These findings are in contrast to another study that determined that only 52% of the general public thinks that climate scientists agree that the Earth is warming and that 47% of the general public believes that climate scientists agree that humans have caused it (http://www.pollingreport.com/enviro.htm) So, there is a definite discrepancy between what the scientific consensus is and what most people think the scientific consensus is.
I have chosen to discuss a few samples of model predictions from the Intergovernmental Panel on Climate Change for two reasons. The first is that its publications are the result of a huge collaborative international effort, so the plots you see below are have incorporated the widest agreement among climate scientists. Secondly, its estimates are pretty conservative (having to get past the most politicians) so we can proceed to look at their predictions without wondering whether these people are just a bunch of fringe group alarmist crackpots. They're not!
The first set of plots below shows a prediction of average global temperature rise from the present to the year 2100. The different line types represent several different model runs using six different "scenarios." These are called SRES scenarios and the main differences among them are the assumptions they make about the world's population and its greenhouse gas emissions into the future (i.e., whether emissions will continue to rise at today's pace, or whether emissions will stay at today's level but not continue to rise, or whether we will decrease emissions). The idea here is to bring climate modelers together, give them a suite of reasonable future scenarios, and then have them all run their models and see what the output is. Note that all models accurately reproduce past average temperature measurements (see right panel "1765–2100"). This is important because it establishes that these models can do a good job of "predicting" what has already happened. These models predict an increase in the global average temperature of between 1° and 6°C. Remember from our reading that during the last ice age the average temperature was only about 9°C colder than now.
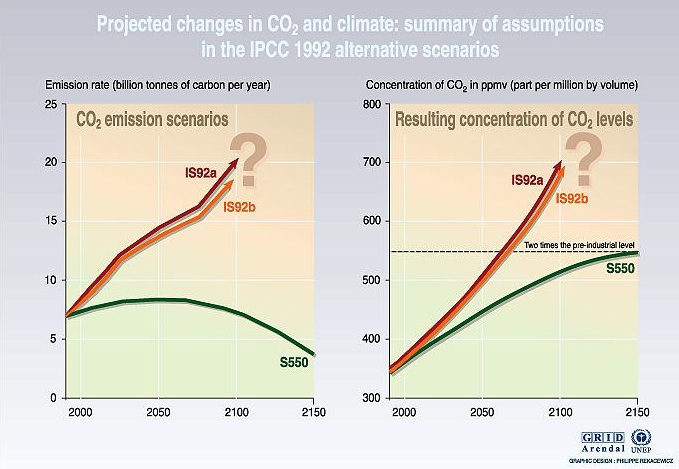
Understanding how CO2 concentrations in the atmosphere will change in the future requires carbon cycle models which model the relationship between emissions and atmospheric concentrations. In the figure below, a few selected emission scenarios are shown in the left panel, and the estimated CO2 concentrations in the atmosphere for these scenarios are shown in the right panel. All three scenarios—even one in which we reduce our rate of emission—result in increased atmospheric concentrations that are well above pre-industrial levels by 2100 (75% to 220% higher). Climate-induced environmental changes cannot be reversed quickly. Even if the anthropogenic emissions of CO2 are stabilized or reduced, the CO2 content in the atmosphere will still increase for some time.
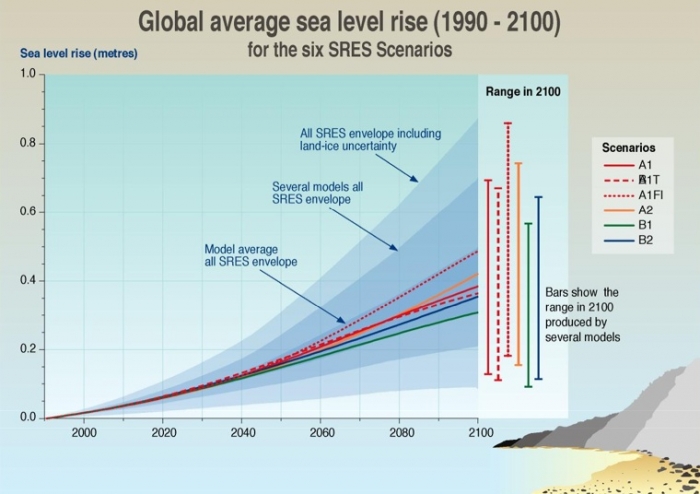
The paper detailing the study of Alaskan glacier wastage we read last week explains one of the results of a warming global climate: rising sea level. The plot below shows model predictions for global average sea level rise based on six emission scenarios. Think about how average sea level is measured. It's not so simple when you think about it. Remember from the tsunami lesson that at many places on the globe, daily tidal fluctuations are on the order of meters. Both tides and average sea level have natural seasonal variations, too. This means that average sea level must be measured carefully with respect to a reference point. It would be easy to produce a misleading dataset if measurements were taken haphazardly at different times of the year or without respect to some established baseline.
What effect does rising sea level have? What proportion of humanity lives within a meter of sea level? The model predictions in the plot below guess that by 2100 sea level might rise by about half a meter. These models probably err on the conservative side because they don't take into account as much glacial melting as many scientists now believe will happen.