The world's climate system does not respond fully and immediately to externally applied forcing. This lag time has allowed the debate about the effect of human activities on climate to go on longer than it would have if everything we did were instantly noticeable. For example, when a certain amount of extra CO2 is added to the atmosphere, the warming effects on the air, land, and ocean take some time to be fully realized. Even if there was a way to add heat directly to the Earth, it would still take time for the temperatures we measure to increase. In this activity, we'll conduct a simple experiment to observe the specific heat capacity of water. By doing so, we'll be able to gain some insight about the lag time of the climate system's response to external forcing.
The specific heat capacity (Cp) of liquid water at room temperature and pressure is approximately 4.2 J/g°C. This means it takes 4.2 joules of energy to raise 1 gram (or 1 milliliter if you'd rather think of the equivalent volume of 1 gram of water) of water by 1 degree Celsius. This is actually quite large. The specific heat capacity of water vapor at room temperature is also higher than most other materials. Here is a table of the specific heat capacities of various materials:
| Material | Cp(J/g°C) |
|---|---|
| liquid water | 4.2 |
| air | 1.0 |
| water vapor | 1.9 |
| granite | 0.8 |
| wood | 1.7 |
| iron | 0.0005 |
Note that none of the other materials listed above come close to water's ability to absorb heat. (Nitpicker alert: Water does not have the highest known heat capacity. The heat capacity of pure hydrogen gas at room temperature is 14.3 J/g°C, according to the CRC Handbook of Chemistry and Physics. Pure H2 is not a big player in the Earth's climate system, though.)
The high Cp of water is why "a watched pot never boils!" This is also the main reason the climate is slow to respond to external changes. It is lucky for us that the ocean has the ability to absorb a lot of heat before its temperature rises appreciably. The flip side of this is that once an external source of energy is removed, the ocean is similarly slow to respond. Its temperature will not begin to decrease right away. In the next activity, we will observe this phenomenon.
Optional Fun Lab!: Specific Heat Capacity of Water Lab Experiment
The world climate does not respond immediately to the external forcings applied by human activity. A simple way to show why this is so is to make some simple observations about the heat capacity of water.
Materials
These are the materials you need for this lab: water, a pot, a thermometer, a stove or other heat source, a watch or other timer.
Directions
- Measure a volume of water (you can choose the volume) into your pot.
- Measure the starting temperature of the water.
- Put the pot on the stove and turn on the stove (you can choose how high to turn it up, but keep the level constant)
- Measure the temperature of the water at regular intervals. It is up to you to decide how often you need to make measurements.
- When the water boils, note the time, and remove the pot from the heat.
- Continue to make regular measurements of the temperature of the water until it cools back down to the initial temperature from step 2.
- Now pick an experimental variable, such as the initial volume of water in the pot, the kind of pot, how high to turn on the stove. Change this variable and repeat the experiment. Change this same variable at least one more time and do the experiment again.
Answer the following questions:
- Plot your data for each experiment.
- How long did it take each pot of water to boil?
- How long did it take each one to cool back down?
- Eyeball a best fit function to the water-heating-up data for each experiment. What do these functions look like (linear? curved? could you write an equation down to describe them?) What is indicated by the shapes of these functions? Were they affected by the changes you made between experiments?
- Eyeball a best fit function to the water-cooling-down data for each experiment. What do these functions look like? Are they all similar to each other? Do they have the same form as the water-heating-up functions? Discuss why or why not.
- Describe which experimental variable you changed and how the change you made affected your results.
- Speculate about what would have happened if you had chosen a different experimental variable to change. Predict how changing that other experimental variable would have changed your results.
- How could you improve this experimental design?
Note:
This is optional, so there is nothing to turn in for this assignment, but this is a fairly simple and instructive experiment, so give it a try if you get a chance!
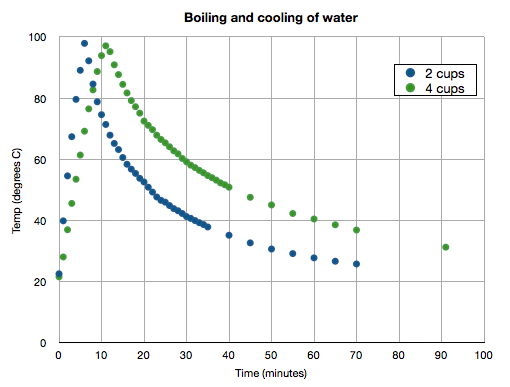
See my plot below of two experiments in which I varied the initial volume of water in the pot. Note how much time it takes for the water to return to the starting temperature after boiling!