Sea Ice
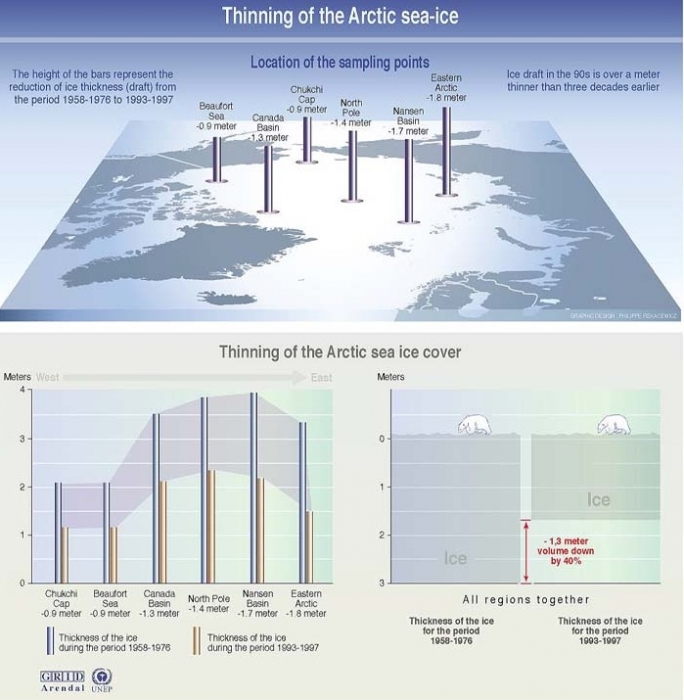
One of the direct consequences of a climate that is becoming warmer on average is that global repositories of ice are beginning to melt. Measuring the amount of melting takes time and requires repeated observations because ice caps and glaciers have natural seasonal cycles (more ice in the winter, less ice in the summer). Below is a schematic figure showing data collected for forty years in the Arctic. Polar sea ice thinned by an average of over a meter during that time!
Glacial ice
A survey of over 60 glaciers in Alaska has shown an alarming trend. On average, glaciers have been thinning from 1950 onwards. The rate of thinning has rapidly increased during the last ten years or so. Be careful to note the difference between discussing the amount of thinning and the rate of thinning. The amount of thinning is found by measuring the thickness of ice at two different times and subtracting. The rate of thinning refers to how fast the ice is getting thinner. Mathematically, the rate of thinning is the derivative of the amount of thinning, just like velocity is the derivative of displacement if you want to think of it in terms of simple motion. So, even if the rate of thinning was a constant number, say 10 centimeters per year, the amount of thinning would still be increasing every year (by 10 cm). The two figures below show a map of the glaciers from Arendt et al.'s 2002 study of Alaskan glaciers and a bar graph that denotes the rate of thinning for two different time periods of each glacier in the study. The observation of an increase in the rate of thinning is like an acceleration, to continue the analogy to simple motion. It means that glaciers in the past 10 years have been thinning even faster than they used to be.
Consequences of melting ice
What happens when ice melts? That's easy: it turns into water. Where does the water go? Eventually, it finds its way into the ocean. In the case of Arctic sea ice, the contribution of melt to global sea level is negligible. That's because this ice is already sitting in the water. The density of ice is less than that of water, but not by a whole lot. On the other hand, when Alaskan glaciers melt, this extra water does increase sea level around the world because the ice had been trapped on the land before. The activity below demonstrates this principle in a simple way.
Try this!
- Get a clear glass and fill it about half full with water. A pint glass works well for this.
- Mark on the side with a china marker the level of the water.
- Put a few ice cubes in the water and make another mark where the level of the water is now.
- Observe how much of the ice is above the top of the water and how much is hanging below. The amount below is called the "draft."
- Let your glass sit around until the ice melts. Notice that the level of the water is not too much different from the higher mark you made. Melting the floating ice doesn't raise the water level very much compared the initial amount it was raised by adding the ice to the system in the first place.