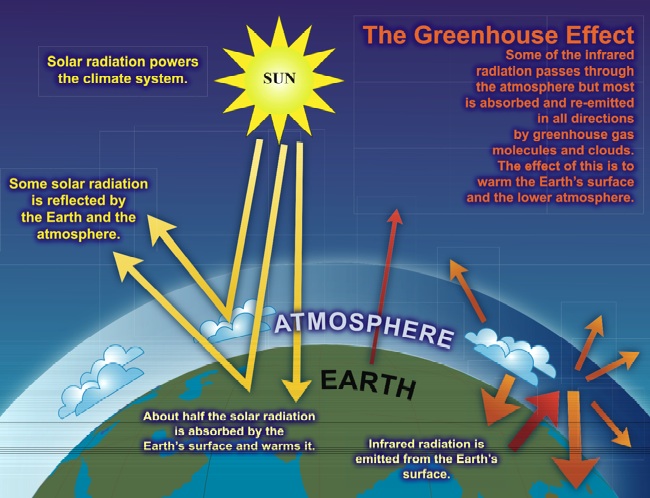
The Greenhouse Effect
One of the most common misconceptions about global climate is that the greenhouse effect is just a hypothesis whose role in recent climate change is debatable. In fact, the greenhouse effect is an observable fact of what goes on in our atmosphere. The sun's radiation is transmitted to the Earth through our atmosphere. Some of this radiation is reflected back out into space, but some of the radiation in the infrared spectrum gets absorbed and re-radiated by the greenhouse gases in our atmosphere. This warms up the surface of the planet and it's an extremely important effect because without it the planet would be way too cold for us to live on it. The schematic cartoon below depicts this. The main greenhouse gases are water vapor (making up about 2/3 of the total), carbon dioxide, and methane. These all occur naturally, but human activities have increased the concentrations of carbon dioxide and methane through industrial activities and clear-cutting forests. We've also synthesized some greenhouse gases that aren't naturally occurring and added those to the atmosphere, too.
Even though Earth's natural carbon cycle moves a gigantic amount of carbon between the land, sea, and atmosphere naturally, the balance is pretty delicate and the amount humans have been adding to the atmosphere since the Industrial Revolution lingers in the atmosphere for over 100 years. This means that the effects of climate change we feel now were produced by activities in the past. The fact that greenhouse gases keep being emitted by human activity now means that we have already committed to a warmer future.
Carbon dioxide
The "Keeling Curve" might be the most famous plot of global climate data. Charles Keeling began measuring the atmospheric concentration of carbon dioxide at Mauna Loa in 1958. Today, four air samples an hour are collected from the observation towers at Mauna Loa and the concentrations of several gases are measured. The NOAA keeps track of observations from over 50 stations around the world. The average concentration of CO2 in the atmosphere has steadily increased ever since monitoring began.
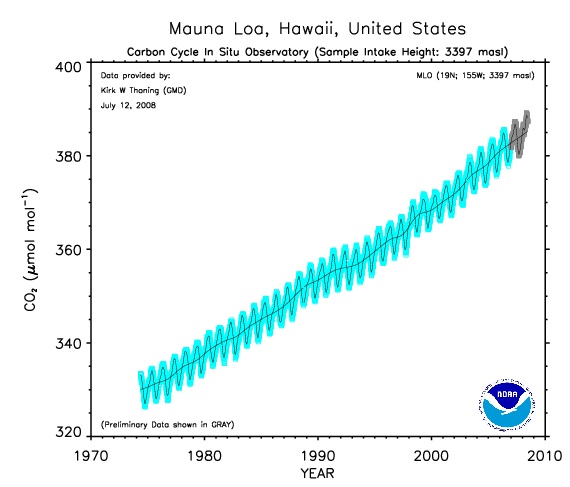

Let's take a look at this plot together (oops! note that in my explanation I mistakenly say that the y-axis is carbon dioxide concentration in millimoles per mole of air when in fact it is micromoles per mole.):
In addition, check out this really cool animation that shows how carbon dioxide concentrations have increased in the atmosphere globally over the past few decades. In the video, the x-axis is latitude and the y-axis is CO2 concentration. The various different symbols represent different types of recording stations (tower, airplane, etc) and the line is an average value.