The Volcanoes Exploration Program at Pu'u O'o
VEPP was a project funded by NASA, implemented by USGS, and supported by SOEST at the University of Hawai‘i at Mānoa. The project lasted for about 5 years from 2010-2015. The project goal was to make available a subset of volcano monitoring data from the Hawaiian Volcano Observatory (HVO) for educational purposes. The Web site—with data streams from the Hawaiian Volcano Observatory—provided a means for students to experience and interpret current volcano-monitoring data.
The blurb above was cribbed directly from the now-sunsetted Volcanoes Exploration Program at Pu'u O'o web site and explains the point of the project. Even though the project is over we are still able to use its data for the second part of the problem set in this lesson.
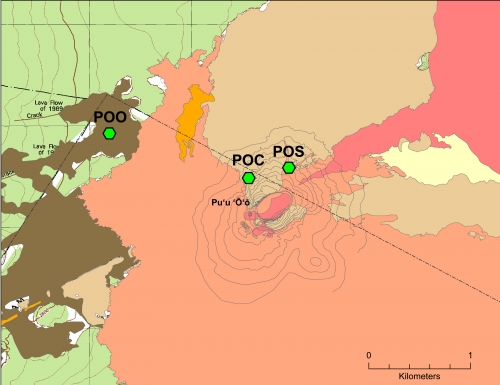
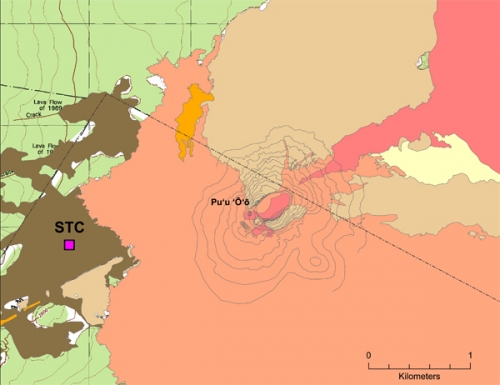
The data provided by the VEPP program comes from the Pu'u O'o vent, which is on the east flank of Kilauea, so it represents just a subset of the many monitoring activities of the Hawaiian Volcano Observatory. See the map below to find the location of Pu'u O'o. It is one of the vents in the East Rift zone, the source of most of Kilauea's recent lava flows.
Instrumention
There are a variety of different instruments installed around Pu'u O'o to track what the volcano is doing in real-time. The general purpose of these measurements is to alert the scientists who receive the data about whether an eruption is imminent. This goal is worthy enough, but there is also the overarching scientific goal of getting a better understanding of how the plumbing system of a volcano works in the short-term and in the long-term. Here is a list of the types of instruments that record the data we'll explore, and a brief description of each one.
Tiltmeters
Tiltmeters are installed to measure any change in the angle of the ground with respect to horizontal. The goal is to make an observation of any bulge or inflation of the ground around a vent, which could be indicative of rising magma. Once an eruption has begun, tiltmeters can also measure deflation as the source of the eruption escapes from the ground. Below is a map of the three tiltmeters installed at Pu'u O'o. The Hawaiin Volcano Observatory (HVO) web site also has some detailed information about tiltmeters and what their data look like.
GPS stations
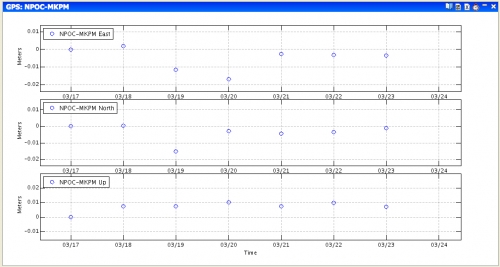
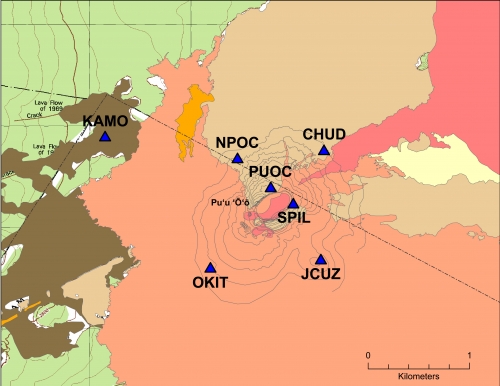
Pu'u O'o has a network of seven GPS stations (see map below) that continuously monitor the location of each station to within several millimeters by recording signals from orbiting satellites. You will recall from the New Madrid lesson in Earth 501, that GPS stations are routinely used to monitor the movement across faults and to confirm the magnitude and direction of plate motions inferred from magnetic sea-floor anomalies. At active volcanoes, GPS data is used to keep track of any surface deformation of the volcano. The HVO website also has some more detailed information about GPS stations and some examples of data from them.
Seismometers
Pu'u O'u has two seismometers, located in the same place (see map below), but measuring different frequency bands. One of them is a "short-period" seismometer, which is sensitive to higher frequencies, such as the harmonic tremor that is often associated with the movement of magma at active volcanoes. The other seismometer is a "broadband" instrument, which is sensitive to a wider range of frequencies than the short-period instrument, and to generally lower frequencies. Broadband seismometers are installed all over the world to monitor ordinary earthquakes, but short-period seismometers are usually only for measuring what is going on in a small locality. If you want to see recent earthquakes recorded in Hawaii, you can check out HVO's seismicity map.
Webcams
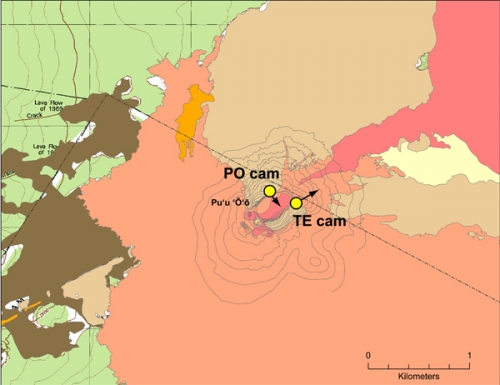
Pu'u O'o has two webcams that each take a snapshot every few minutes. One of them is mounted on the north rim of the crater and looks southward into the crater. The other one is installed on the southeast flank of Pu'u O'o. It looks east across the currently active vent.
An example of an Inflation-Deflation event recorded at Pu'u O'o and how I made these plots
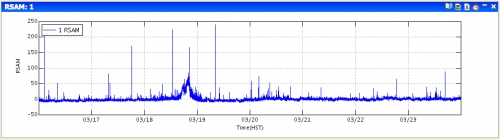
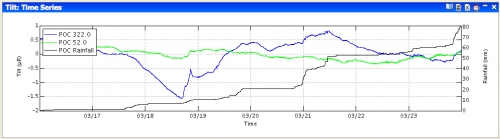
The three plots below show seismic (top), tilt (middle), and GPS (bottom) instrument records for 17-23 March 2009 at Pu'u O'o. I found this event by searching month-by-month using the software package the HVO scientists use, which used to be available to educators when the VEPP project was going on. I looked for distinctive jumps in the seismic amplitude data. Once I found one, I looked to see if it correlated with a tilt and GPS signal. The data depicted in these plots tell us about the behavior of the volcano's inner workings.
RSAM (seismic) data
Tilt data
GPS data