Three examples of reading in a file, doing something with its contents, plotting the result.
New syntax: loadStrings, split, map, log
0. Make a scatter plot from data in a plain text file
The box below contains the contents of a plain text file named "cards_data.txt" that I created using vi and have dragged and dropped onto my sketch. There are three columns separated by tabs. The first column is a list of last names of 2002 St. Louis Cardinals position players (no pitchers). The second column lists the number of RBIs each of them earned that year and the final column is each of their salaries in millions of dollars. The format of this file looks kind of ugly because some of the names are too long for the tabbing to work out right, but Processing won't care about this! We are going to read this text file into Processing using loadStrings. Then we are going to make a plot out of it.
Cairo	23	0.85
Drew	56	3.6
Edmonds	83	8.33
Marrero	66	1.5
Martinez	75	7.5
Matheny	35	3.25
Palmeiro	31	0.7
Perez	26	0.5
Pujols	127	0.9
Renteria	83	6.5
Robinson	15	0.32
Rolen	110	7.625
Vina	54	5.33
Here's the program, and a screenshot of the plot I made.
//this data is the number of RBIs in 2002 for Cards position players
//and their salaries (in millions of $)
//we will read the data in from a 3-column plain text file

String[] cards; //make the array and fill it with data later

void setup() {
   size(200, 200);
   background(255);
   PFont font1;
   font1 = loadFont("AbadiMT-CondensedLight-14.vlw");
   textFont(font1);
   smooth();
   cards = loadStrings("cards_data.txt"); //this is how we read in the file contents
   noLoop(); //just drawing a static plot once
}

void draw() {
   //make a grid for plotting. use translate to leave some blank space for labels
   translate(50, -50);
   stroke(200);
   for (int i = 0; i< 100; i=i+20) {
   line(i, 60, i, height); //vertical gridlines
   line(0, height-i, 140, height-i); //horizontal gridlines
}

//plot the data
stroke(0);
fill(75);
println("number of lines in data file is " +cards.length);

//go through the array called "cards" line by line
for (int i = 0; i<cards.length; i++) {

	//split each line where there is a tab
	//create a new array of strings called "data" to hold this info
	String[] data = split(cards[i], '\t');

	   String Name = (data[0]); //player name in first column
	   int Rbi = int(data[1]); //Rbi in the second column
	   float Salary = float(data[2]); //Salary in third column

	   //make a scatter plot of Rbi v. salary
	   ellipse(Rbi, height-Salary*10, 10, 10); //want the axes origin at lower left, so do (height - y data)
   }

   //label the axes
   //I did these by trial-and-error until I got them to look right
   fill(0);
   text("RBIs", (width/2)-50, height+30);
   text("Salary $ mil", -50, 100, 30, 100);
   text("20", 15, height+15);
   text("60", 55, height+15);
   text("100", 95, height+15);
   text("2", -10, height-15);
   text("6", -10, height-55);
   text("10", -15, height-95);
}
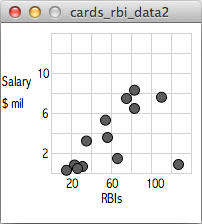
 The main purpose of this plot is to show you how easy it would be to ditch your job and start making millions as an agent. Look how well RBIs correlate to salary! Albert Pujols was glaringly underpaid (making $900,000 and accumulating 127 RBIs) according to this metric but he negotiated a new contract with the Cardinals after the 2003 season that paid him upwards of $10 million per year, which puts him right in line with where the RBI prediction says he should be.
The secondary purpose of this plot is to demonstrate a few new commands and how to deal with an external data file. Inside setup() we used loadStrings to read the file into the program. You want to do all the reading-in of external files in setup() because that block just runs once and you don't want your cpu hogged by re-loading your files every time you run through draw(). The file will be loaded in as lines of String variables. The first thing we want to do is tell Processing that we actually want three columns, not 13 lines. So, we go through the data file line by line and split each line where there are tabs. The syntax '\t' tells Processing to look for a tab.
The fact that the data comes in as strings works out great for the player names because they are words. But if we want to do some arithmetic with the numbers, or otherwise treat them as numbers, then we have to convert them to other variable types. Inside the for loop where we run through the data file, we first split each line into three pieces, making a three-element array named data. Then we rename each element in the data array and convert it to another variable type if we want to. For example, we made an integer array out of the RBI data, and we made a float array out of the salary data. The chunk of code that does all that is here:
String[] data = split(cards[i], '\t');
String Name = (data[0]);
int Rbi = int(data[1]);
float Salary = float(data[2]);
Then we plot Rbi v. Salary.
ellipse(Rbi, height-Salary*10, 10, 10);
The rest of the program is devoted to doing the background work that spreadsheet and other canned plotting programs do for you. Here's where we make some gridlines:
//make a grid for plotting. use translate to leave some blank space for labels
   translate(50, -50);
   stroke(200);
   for (int i = 0; i< 100; i=i+20) {
   line(i, 60, i, height); //vertical gridlines
   line(0, height-i, 140, height-i); //horizontal gridlines
}
Here's where we label the axes:
//label the axes
   //I did these by trial-and-error until I got them to look right
   fill(0);
   text("RBIs", (width/2)-50, height+30);
   text("Salary $ mil", -50, 100, 30, 100);
   text("20", 15, height+15);
   text("60", 55, height+15);
   text("100", 95, height+15);
   text("2", -10, height-15);
   text("6", -10, height-55);
   text("10", -15, height-95);
Of course this is a slightly more tedious way to make a simple plot -- you would probably rather just paste this little datafile into your favorite program and not spend time tinkering with the way the plotting grid looks, right? Sure, but the point is that you can do it this way and you have complete control over the way it looks, which is cool!!