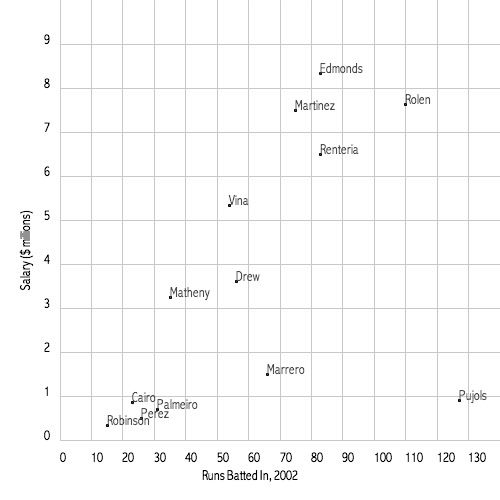
Another take on the Cardinals RBI v. Salary plot
The program on this page demonstrates a lot of the skills we have learned this semester so I'm going to go through it piece by piece. First of all, here is the plot that it draws and the whole code.
//plot some data from an array
//this data is the number of RBIs in 2002 for Cards position players
//and their salary (in millions of $)
//we will read the data in from a 3-column plain text file


String[] cards; //make the array and fill it with data later
int rbiMax=140; //actual maximum in the datafile is 127, this gives some room
int salMax=10; //actual maximum in the datafile is 8.33, this gives some room
int nudge = 30; //gives some border room for the plot

void setup() {
 size(500, 500);
 background(255);
 PFont font1;
 font1 = loadFont("AbadiMT-CondensedLight-14.vlw");
 textFont(font1);
 smooth();
 //this is how we read in the file contents
 cards = loadStrings("cards_data.txt");
 noLoop();
}

void draw() {
 //make a grid for plotting. use map to put the grid where I want.
 //horizontal gridlines and labels
 //SALARY data on y axis. data range is 0.5-8.33, make it 0 to 10

 stroke(200);

 for (int i = 0; i< salMax; i++) {
  line(map(0,0,rbiMax,nudge*2,width),map(i,0,salMax,height-(2*nudge),0),
	map(rbiMax,0,rbiMax,nudge*2,width),map(i,0,salMax,height-(2*nudge),0));
  text(i,map(-5,0,rbiMax,nudge*2,width),map(i,0,salMax,height-(2*nudge),0));
 }

 //vertical gridlines and labels
 //RBI data on y axis. data range is 15-127, make it 0-140.

 for (int i = 0; i<rbiMax; i=i+10){
  line(map(i,0,rbiMax,nudge*2,width),map(0,0,salMax,height-(2*nudge),0),
	map(i,0,rbiMax,nudge*2,width),map(salMax,0,salMax,height-(2*nudge),0));
  text(i,map(i,0,rbiMax,nudge*2,width),map(-0.5,0,salMax,height-(2*nudge),0));
 }

 //plot the data
 //go through the array called "cards" line by line
 //split each line where there is a tab
 //create a new array of strings called "data" to hold this info
 //player name in first column
 //Rbi in the second column
 //Salary in third column

 for (int i = 0; i<cards.length; i++) {
  String[] data = split(cards[i], '\t');
  String Name = (data[0]);
  float Rbi = map(float(data[1]),0,rbiMax,nudge*2,width);
  float Salary = map(float(data[2]),0,salMax,height-(2*nudge),0);

  //make a scatter plot of Rbi v. salary
  ellipse(Rbi,Salary,2,2);
  text(Name,Rbi,Salary);
 }

 //label the axes
 fill(0);
 textAlign(CENTER);
 text("Runs Batted In, 2002", (width/2), height-20);
 pushMatrix();
 translate(30,height/2);
 rotate(-PI/2);
 text("Salary ($ millions)",0,0);
 popMatrix();
}

void mousePressed(){
save("cardsRbiData3.png");
}
Let's break it down:
Philosophy
Let's break down this program into chunks instead of trying to understand the whole thing at once. Think of this as how you would organize a paper, or a lab report. For example, in a scientific paper, you have to start with an introduction and some background knowledge or literature review, then explain your methods, then display your results, then interpret your results, and finally make some general conclusions. You can't tinker with this order too much or else your paper will not flow logically. You wouldn't want to jump right in with the interpretation of your results before you even explain what you were trying to find out and what measurements you made, right?
Similarly, there are some parts of a data-plotting program that have to go in order, as you already know. For example, if you want a shape to be outlined in blue, you have to set that color first and then draw the shape. If you want to plot some data from an external file, you first have to read the data into the program, then you can plot it. If you are making a scatter plot by hand on graph paper you first have to figure out where your origin will be, then figure out the range of the axes before you start plotting the points. Otherwise you won't know where your points should go.
If you use a software plotting application, the whole exercise of figuring out the range of the axes is done for you by the app. You can modify the axes after the fact, but you don't usually have to spend any time up front on that task. This is beneficial for saving time, but not beneficial if you want to teach your students the art of plotmaking. You want your students to look carefully at their data before just tossing it into a plotting program and hoping for the best.
Preamble
I usually use the first few lines of a program to write a note to my future self about what the program is supposed to do, and where I got the data. This is also the place to declare global variables. Here's the preamble from the RBI plotter:
//plot some data from an array
//this data is the number of RBIs in 2002 for Cards position players
//and their salary (in millions of $)
//we will read the data in from a 3-column plain text file
String[] cards; //make the array and fill it with data later
int rbiMax=140; //actual maximum in the datafile is 127, this gives some room
int salMax=10; //actual maximum in the datafile is 8.33, this gives some room
int nudge = 30; //gives some border room for the plot
The first four lines are just notes. Then I declare an array of strings which is going to hold the data that I read in later. I set three global integers. I already looked at my data and I know that the maximum number of RBIs in my file is 127 and the maximum salary is 8.33 million. This tells me approximately what range I ought to use for my x and y axes. It's useful to use a variable here instead of an actual number because what if I write a really long program that refers to the x or y axis range a bunch of times? If I go back and want to change the range for aesthetic reasons or whatever then I'll have to go back and find each place where that number appears. If instead I set that number to what it represents up at the top then if I want to change it I can just change it one time.
The setup() block
If there is a draw(), there has to be a setup(). setup() runs exactly once and the commands are run in order. Variables declared in setup() are not available outside of setup(). Anything that does not need to be changed while the program is running can be put in setup() to save computation time. Here’s a list of things that are commonly in setup().
- size() tells the display window how big to be, and if you will use a 3D renderer.
- Importing external files to be used: fonts, images, and data text files.
- background() if you want to the screen not to be continuously refreshed
The setup() block for this program is:
void setup() {
 size(500, 500);
 background(255);
 PFont font1;
 font1 = loadFont("AbadiMT-CondensedLight-14.vlw");
 textFont(font1);
 smooth();
 //this is how we read in the file contents
 cards = loadStrings("cards_data.txt");
 noLoop();
}
I set the size and background, I load a font, and I read in the data from a plain text file. It's important that I already declared the array cards before setup() because now I can use that array to hold the information I'm reading in and I can also use it later in draw() when I want to do something with it.
The Draw() Block
If there is a setup() there has to be a draw(). draw() runs immediately after setup() and continues to run over and over again until you stop the program. You can tell draw() to go looking for other functions that come after it but you can’t tell it to look in setup() for something. Here’s a list of what’s usually in draw():
- background() if you do want the background to be continually refreshed.
- Stuff that involves updating such as continuous movement and if tests.
- Calls to functions that occur later in the program.
The draw() block for this program is:
void draw() {
 //make a grid for plotting. use map to put the grid where I want.
 //horizontal gridlines and labels
 //SALARY data on y axis. data range is 0.5-8.33, make it 0 to 10

 stroke(200);

 for (int i = 0; i< salMax; i++) {
  line(map(0,0,rbiMax,nudge*2,width),map(i,0,salMax,height-(2*nudge),0),
	map(rbiMax,0,rbiMax,nudge*2,width),map(i,0,salMax,height-(2*nudge),0));
  text(i,map(-5,0,rbiMax,nudge*2,width),map(i,0,salMax,height-(2*nudge),0));
 }

 //vertical gridlines and labels
 //RBI data on y axis. data range is 15-127, make it 0-140.

 for (int i = 0; i<rbiMax; i=i+10){
  line(map(i,0,rbiMax,nudge*2,width),map(0,0,salMax,height-(2*nudge),0),
	map(i,0,rbiMax,nudge*2,width),map(salMax,0,salMax,height-(2*nudge),0));
  text(i,map(i,0,rbiMax,nudge*2,width),map(-0.5,0,salMax,height-(2*nudge),0));
 }

 //plot the data
 //go through the array called "cards" line by line
 //split each line where there is a tab
 //create a new array of strings called "data" to hold this info
 //player name in first column
 //Rbi in the second column
 //Salary in third column

 for (int i = 0; i<cards.length; i++) {
  String[] data = split(cards[i], '\t');
  String Name = (data[0]);
  float Rbi = map(float(data[1]),0,rbiMax,nudge*2,width);
  float Salary = map(float(data[2]),0,salMax,height-(2*nudge),0);

  //make a scatter plot of Rbi v. salary
  ellipse(Rbi,Salary,2,2);
  text(Name,Rbi,Salary);
 }

 //label the axes
 fill(0);
 textAlign(CENTER);
 text("Runs Batted In, 2002", (width/2), height-20);
 pushMatrix();
 translate(30,height/2);
 rotate(-PI/2);
 text("Salary ($ millions)",0,0);
 popMatrix();
}
First I use a for loop to make horizontal gridlines and label them with numbers. Then I use a for loop to make vertical gridlines and label them with numbers. Note use of map() and the global variables salMax and rbiMax to create the ranges for the axes. Next I use a for loop to go through the cards array. This array is holding the information from the external file I read in setup(). Note that I use map() to put the data inside the ranges that I set with salMax and rbiMax. I make a scatter plot with ellipse() and I also label each plotted point with the corresponding player's name using the text() command. At the end I give the axes titles. Notice the use of pushMatrix(), popMatrix(), translate(), and rotate() to make the title of the y axis appear sideways.
After the draw() Block
This is where you put functions that are called in draw(). This is also where you put commands to save the results of computations or save the contents of the display window.
Here's what comes after draw() in this program:
void mousePressed(){
save("cardsRbiData3.png");
}
When I press the mouse inside the display window, an image file is saved into the data folder of this program called cardsRbiData3.png. That's it! The whole program!