Analyze Data with Processing
Remember in Earth 501 when I made you create a frequency-magnitude diagram of a year's worth of earthquakes around the world? I know you were all hating me as you wrestled with the huge dataset and how to do all the sorting and counting by hand. The example program below is a better way to make that plot. First I went to the USGS earthquake catalog search page and made a catalog of all earthquakes for the year 2012. I used vi to get rid of the header info cluttering up the top and bottom of the file, then I used awk to extract the 9th column where the magnitudes are. Since that's the only data I care about for frequency-magnitude diagram purposes, why waste cpu reading in a bigger file? I'll just read in a 1-column file that contains the magnitudes.
//plot some data from an array
//this data comes from a usgs catalog file of global earthquakes in 2012.
//we will read the data in from a 1-column plain text file

String[] mags; //make the array and fill it with data later

void setup() {
   size(400, 400);
   background(255);
   mags = loadStrings("mags.txt"); //this is how we read in the file contents
   noLoop(); //just drawing a static plot once
}

void draw() {

   //working with the data follows from here
   println("number of earthquakes in the data file is " +mags.length);
   //we want to draw a cumulative frequency-magnitude diagram
   //we will plot magnitude on the x axis and number of eq's >= mag on the y axis.
   //so we have to make an array to hold this information, then go through the data file and count.

   //I know my smallest value is 1.1 and my biggest is 8.6 but let's go from 0 to 9 by tenths. That's a 90-element array.

   float[] xValue = new float[90];
   float[] cumHist = new float[xValue.length];
   float[] newCumHist = new float[xValue.length];

   //cumulative histogram
   //I nested the for loops so that we go through the whole data
//file each time we populate one spot in the cumHist array
   for (int i=0;i<cumHist.length;i++){
	  for (int j=0;j<mags.length; j++){
		 float magvalue = float(mags[j]); //convert string to float
		 int newMagvalue = int(magvalue*10); // turns a number like 3.4 into 34 for example
		 if (newMagvalue>=i){
			cumHist[i]++;
		 }
	  }
   }

   for (int i=0; i<cumHist.length; i++){
	  newCumHist[i]=map(log10(cumHist[i]),0,log10(max(cumHist)),height,0);
	  xValue[i]=map(i,0,xValue.length,0,width);
	  line(xValue[i],newCumHist[i],xValue[i],height);
   }

}
// Calculates the base-10 logarithm of a number
	float log10 (float x) {
	return (log(x) / log(10));
	}

//save a plot when mouse clicked in display window
void mousePressed(){
  save("fmplot.jpg");
}

So this program is more complicated than the cardinals rbi plotter or the world map plotter because we are actually doing some calculations with the data we are reading in. In order to make a histogram, I created an array to hold the histogram values, then I use a for loop to populate each entry in the histogram array. Each time I go to the next value of the histogram array I loop through the entire datafile of values to see if each one is greater than or equal to the place where I am in the histogram. If it is, I add one. At the end, I've populated the whole histogram. Remember that we need to plot logarithm of the cumulative number of earthquakes to make the plot have the slope of -1. log() in Processing is natural log (base e), so to get base 10, you have to take the natural log of the value and divide that by the natural log of 10. I do that in a function that comes after draw().
	// Calculates the base-10 logarithm of a number
	float log10 (float x) {
	return (log(x) / log(10));
	}
Note that instead of writing the log10 function with void at the beginning, I wrote float at the beginning instead. That's because this function is designed to output a number. It's much more like a function the way you learned it in your math classes. This function takes a number, calculates the log base 10 of it, and spits it out.
The plotting action of this program happens when I make a line at each place in the array whose height is log10 of the number of earthquakes greater than or equal to that magnitude. I could have made a scatter plot or whatever, but I thought a bar-graph-looking figure would be fun. That happens in this line:
line(xValue[i],newCumHist[i],xValue[i],height);
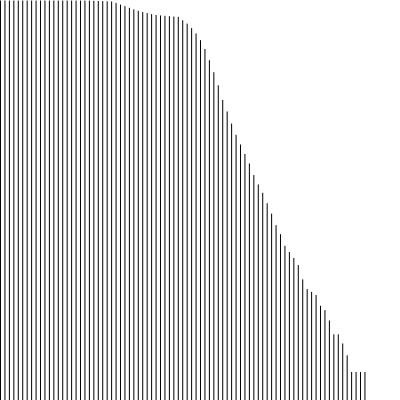
Okay, okay! I know this plot violates all my own rules for good plot-making, such as, it doesn't have any labels anywhere, no title, etc. But the content is correct. The next step is to fix up the plot so that it has all of those things. Guess what! That's an exercise for you!
Exercise
Go back to the New Madrid frequency-magnitude problem set from Earth 501, and pick one plot to recreate using Processing skills to make a plot. You can pick one year of earthquakes from New Madrid, or one year from the southern California catalog, or one year from the world (similar to what I did, above), or some combination of those.
What I'm looking for
In your program, I'd like to see correct use of loading a text file and working with array data. In your finished plot I'd like to see a correct cumulative frequency-magnitude diagram with nice-looking labels and a title.
Submit your program and all ancillary files needed to run your program to the Exercise 8.0 dropbox. Remember to zip your folder and submit that so that I have all the extra files needed.