A World Map
I got this data file from the NOAA coastline extractor, which is now obsolete but you can find a similar version of it at the CIA World Data Bank II. I'm not giving you a screenshot of the datafile this time because it is a 1.2 Mb file with over 62,000 lines. And that's the low-res version! Try pasting that one into Excel! However the program that makes this plot is quite simple:
//plotting a map of the world

String[] coast;

void setup() {
   size(600,300);
   coast = loadStrings("coastText.txt");
   noLoop();

}

void draw() {
   background(255);
   float[] coastLon = new float[coast.length];
   float[] coastLat = new float[coast.length];
   float[] newCoastLon = new float[coast.length];
   float[] newCoastLat = new float[coast.length];

   for (int i=0; i<coast.length; i++){
	  String[] data = split(coast[i], ' ');
	  coastLon[i] = float(data[0]);
	  coastLat[i] = float(data[1]);
   }

   for (int i=0; i<coastLon.length; i++){
	  newCoastLon[i] = map(coastLon[i],-180,180,0,width);
	  newCoastLat[i] = map(coostLat[i],-90,90,height,0);
   }

   stroke(50);
   for(int i=0; i<coastLon.length; i++){
   point(newCoastLon[i],newCoastLat[i]);

}
 We read the file in, then because each line of the data file has two numbers, longitude and latitude, we split each line and populate two new arrays, one for longitude and one for latitude. In this data file there's just a blank space in between the numbers, not a tab, so that's why the second option in split has an empty space surrounded by single quotes. There's another for loop in which I use map to make the data plot in a way that exactly fills the display window. map takes 5 options. They are: the value itself, the original min and max range of that value, and then the min and max of the range you are changing it to. So for longitude, the "value" is just whatever the longitude in the data file is, the range of longitude is the whole Earth's longitude, so it's -180 to +180. Then the range we are plotting to is the window size, so between zero and the width of the window. map is great because it does the work for you of having to figure out the scale of things. Why would you want to spend time trying to calculate where 60 degrees east should go when map can do it for you?
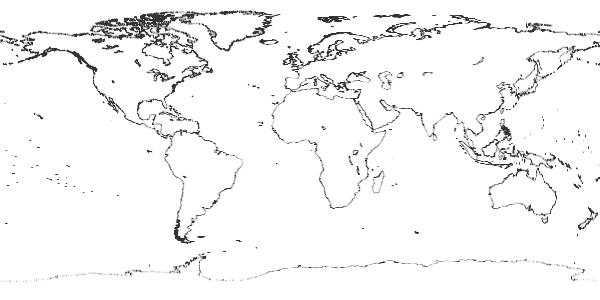
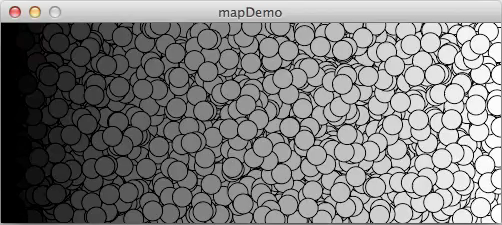
I should point out here that it is just a coincidence that I used map to make an actual map. In fact, map is handy anytime you have a variable with a natural range to it but you want it to be expanded or contracted proportionally to a different range. For example, here is a program where map is used to expand the greyscale, which normally goes from 0 to 255, to a range that goes from 0 to 400, the width of the screen:
// demo use of "map"

float x;
float y;

void setup() {
   size(500,200);
}

void draw(){
   x=random(width);
   y=random(height);
   int a= int(x);
   color colr = int(map(a,0,width,0,255));
   fill(colr);
   ellipse(x,y,20,20);
}