Quiz Yourself!
Further explanation: This is a for loop. The loop variable goes from zero to five by ones. Look at the two lines of code inside the for loop. One of them is the command to draw a line. Drawing a line has four arguments and they are x1, y1, x2, y2. In this program, the x1 is always 35 and the x2 is always 50. The y1 and y2 look like a mess but they are the same as each other, so this code draws six horizontal lines.
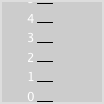
The lines are evenly spaced between the top and bottom of the display window. That is what map does for us. We do not have to calculate where each line will be. We just map the values onto the range we want in the display window. I mapped the six lines from height-1 to 1 instead of height to 0 because lines plotted right on the border of the display window would not have shown up.
The other command inside the for loop puts a text label next to each horizontal line. In fact it writes the value of i, which is a number. You can see that text is placed with its origin at the bottom left, so that's why the number 5 is cut off.
The lines are black and the text is white because we didn't set fill or stroke. Processing therefore uses the defaults:fill(255) and stroke(0).