Recent studies by NASA and others have indicated that about 40 percent of the ozone in the Antarctica has been destroyed and that about 7 percent of ozone is destroyed from the Arctic Circle. The destruction of ozone is also called “Ozone Hole."
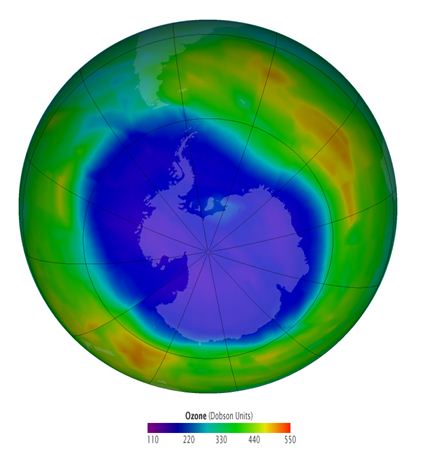
Ozone hole does not mean that there is no ozone in the region. The ozone hole is defined as the area having less than 220 dobson units (DU) of ozone (concentration) in the overhead column (i.e., between the ground and space).
The image below shows the reduction in ozone concentration over Antarctica. This hole in the Antarctica is unfortunately allowing more Australians to be exposed to UV radiation. However, if this kind of ozone destruction ever takes place in the Arctic zone, more humans (in the Northern Hemisphere) would be exposed to higher levels of UVB radiation.


A Dobson Unit is the measure of the amount or thickness of ozone in the atmosphere. It is based on a measurement taken directly above a specific point on the Earth's surface. One Dobson unit refers to a layer of ozone that would be 0.001 cm thick under conditions of standard temperature (0 degree C) and pressure (the average pressure at the surface of the Earth). The Dobson unit was named after G.M.B. Dobson, who was a researcher at Oxford University in the 1920s. He built the first instrument (now called the Dobson meter) to measure total ozone from the ground.
The size of the Southern Hemisphere ozone hole as a function of the year is shown in the figure below. The graph compares the size of the hole over a twenty-year period, from 1980 to 2010. It can be seen that the size increased each year. Each year, in the spring, the ozone hole is at its largest.
