
Here are some examples of infographics that may give you some ideas and inspiration! This is just a few examples. You can find many more with a simple Google search.
Example 4
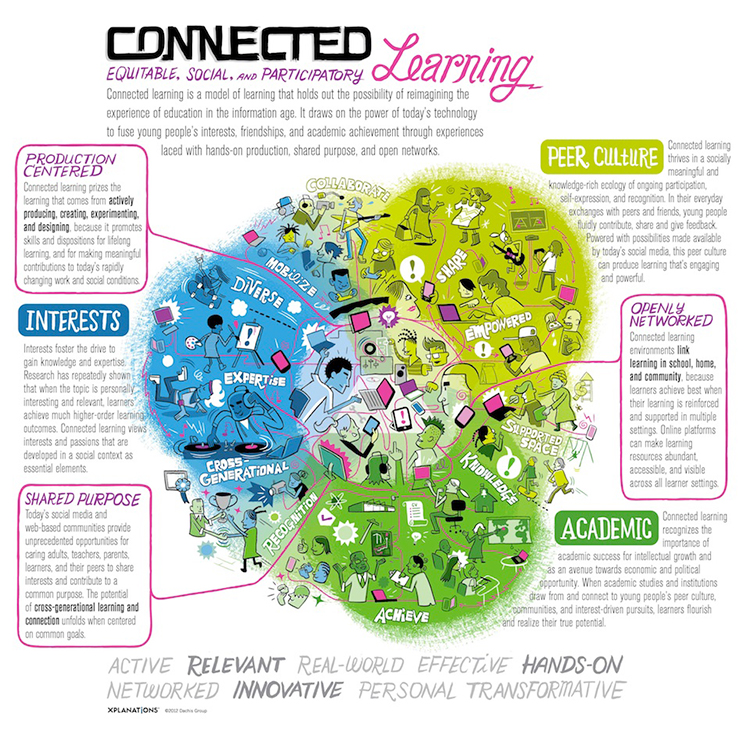
This example focuses an audience's attention into the center of an illustration, using color to organize the learner's experience and interconnections. There's A LOT going on within this illustration, and the minute detail can make the reading of the infographic seem like a puzzle to untangle. While visually appealing, I wouldn't recommend using this much text.
Connected: Equitable, Social, and Participatory Learning
Connected learning is a model of learning that holds out the possibility of reimagining the experience of education in the information age. It draws on the power of today’s technology to fuse young people’s interests, friendships, and academic achievement through experiences laced with hands-on production, shared purpose, and open networks.
- Production Centered: Connected learning prizes the learning that comes from actively producing, creating, experimenting, and designing, because it promotes skills and dispositions for lifelong learning, and for making meaningful contributions to today’s rapidly changing work and social conditions.
- Interests: Interests foster the drive to gain knowledge and expertise. Research has repeatedly shown that when the topic is personally interesting and relevant, learners achieve much higher-order learning outcomes. Connected learning views interests and passions that are developed in a social context as essential elements.
- Shared Purpose: Today’s social media and web-based communities provide unprecedented opportunities for caring adults, teachers, parents, learners, and their peers to share interests and contribute to a common purpose. The potential of cross-generational learning and connection unfolds when centered on common goals.
- Academic: Connected learning recognizes the importance of academic success for intellectual growth and as an avenue towards economic and political opportunity. When academic studies and institutions draw from and connect to young people’s peer culture, communities, and interest-driven pursuits, learners flourish and realize their true potential.
- Openly Networked: Connected learning environments link learning in school, home, and community, because learners achieve best when their learning is reinforced and supported in multiple settings. Online platforms can make learning resources abundant, accessible, and visible across all learner settings.
- Peer Culture: Connected Learning thrives in a socially meaningful and knowledge-rich ecology of ongoing participation, self-expression, and recognition. In their everyday exchanges with peers and friends, young people fluidly contribute, share and give feedback. Powered with possibilities made available by today’s social media, this peer culture can produce learning that’s engaging and powerful.
ACTIVE RELEVANT REAL-WORLD EFFECTIVE HANDS-ON NETWORKED INNOVATIVE PERSONAL TRANSFORMATIVE
This infographic is a bit “busier” and “free-flowing”, using a lot of graphics and organizing things by color. It leads with “CONNECTED” in large black text, followed by a subheading of
“Equitable, Social and Participatory Learning” in purple and pink with a smaller, gray paragraph underneath explaining the purpose of the infographic. Then it starts to get a little busy.
In the center there is a blob of graphics, split into an even, three different colors: blue, dark green and light green. Blue is labeled “Interests” and has graphics of characters partaking in different activities like dancing, painting, skateboarding, etc. and also has a small box of gray text underneath. The format is the same for the light green “Peer Culture” section and the dark green “Academic” section. In addition to the characters, there are words written in white bubble letters. In the blue section, there are the words: “cross-generational”, “expertise”, “diverse”, and “space”. Lastly, in the dark green area, there are the words: “knowledge”, “achieve”, and “recognition”.
There are also three more text boxes, surrounded by a pink border with lines drawn to the center of the “blob”, placed between the other three text boxes. There’s “Production Centered” placed between “Interests” and “Peer Culture”, “Shared Purpose” placed between “Interests” and “Academic”, and “Openly Networked” placed between “Peer Culture” and “Academic”. At the very center of the “blob”, it seems that all of these different elements connect.
At the bottom of the infographic, there are several keywords listed in large gray text.
Example 5
This example utilizes historical imagery and variations in sizing of both photographs and text to emphasize key information.
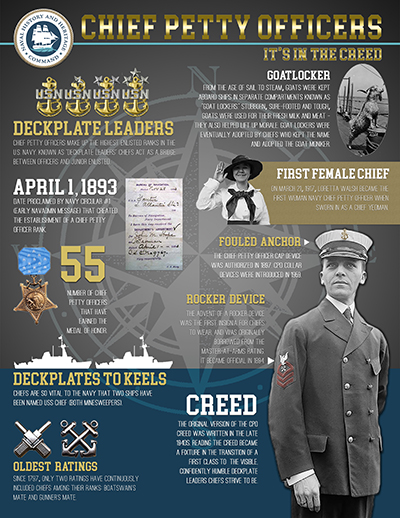
NAVAL HISTORY AND HERITAGE COMMAND
Chief Petty Officers: It’s in the Creed
- Deckplate Leaders: Chief petty officers make up the highest enlisted ranks in the U.S. Navy. Known as “Deckplate leaders” chiefs act as a bridge between officers and junior enlisted.
- April 1, 1893: Date proclaimed by Navy circular #1 (early navadmin message) that created the establishment of a chief petty officer rank.
- 55: Number of chief petty officers that have earned the medal of honor
- Deckplates to Keels: Chiefs are so vital to the Navy that two ships have been named USS CHIEF (both minesweepers).
- Oldest Ratings: Since 1797, only two ratings have continuously included chiefs among their ranks: Boatswain’s Mate and Gunner’s Mate.
- Goatlocker: From the age of sail to steam, goats were kept aboard ships in separate compartments known as “Goat Lockers.” Stubborn, sure-footed and tough, goats were used for their fresh milk and meat – they also helped lift morale. Goat lockers were eventually adopted by chiefs, who kept the name and adopted the goat moniker.
- First Female Chief: On March 21, 1917, Loretta Walsh became the first woman Navy chief petty officer when sworn in as a chief yeoman.
- Fouled Anchor: The chief petty officer cap device was authorized in 1897. CPO collar devices were introduced in 1959.
- Rocker Device: The advent of a rocker device was the first insignia for chiefs to wear, and was originally borrowed from the master-at-arms rating. It became official in 1894
- Creed: The original version of the CPO Creed was written in the late 1940s. Reading the creed became a fixture in the transition of a first class to the visible, confidently humble deckplate leaders chiefs strive to be.
This infographic has a simpler design, mainly focusing on three/four colors: blue, yellow/gold, gray and white. At the very top of the infographic is the title: “Chief Petty Officers: It’s in the Creed” in gold and then there are 10 headers with a sentence or two below describing the header. The headers are either gold or white, but all of the text below them are white. Additionally, all of the headings have images next to them to give the reader a visual. The background of the infographic is a dark gray with a light gray “stamp” of a compass. Additionally, the bottom 20% of the background has a blue/teal overlay.
Example 6
This "top ten" list simply draws the attention vertically downward in a sequential series of steps. The simple display of color and patterning communicates the learner's message clearly.

Pain Doctor: We Change Lives Here
Top 10 Pain Breakthroughs in 2014
- University of Toronto finds 30% of children whose parents suffer from addiction are at risk to develop arthritis
- UNC researchers create a new comprehensive way to table pain management
- Genes may predict pain levels, notes American Academy of Neurology scientist
- Researchers at Rutgers find acupuncture can help with inflammation
- Washington University scientists stimulate bone growth to help osteoporosis patients
- Placental stem cells may help treat multiple sclerosis symptoms finds Mount Sinai researchers
- Two new experimental migraine medications are presented at the American Academy of Neurology
- Laval University scientists find new way to reduce pain sensitivity
- Whole body vibration can relieve fibromyalgia pain, notes Indiana University researchers
- McGill University scientists study medical marijuana effects on nerve pain
Read more at Top 10 Biggest Pain Breakthroughs 2014
This infographic is very simple. The title of the infographic, “Top 10 Pain Breakthroughs in 2014” is placed on the cover of a newspaper with a stripe of teal behind it, on the otherwise white/gray background. Below that are ten different breakthroughs in green boxes with images corresponding to each of them, alternating from the right side to the left.