
1.5. Fundamentals of Systems Analysis
To build the contextual framework for applying the sustainability principles, we need to develop some background in systems. We often hear terms like “systems thinking” or “systems approach”. Or in some cases, to initiate a sustainable and long-lasting change, we need to change the “system” rather than trying to change the final result. The material in this section is the tip of a bigger iceberg – system analysis is applicable to a very broad scope of problems, from economics to climatology, and it very often becomes a powerful tool in strategic decision-making. In this course, the systems approach will be essential when we consider technology trends and implementation in a broader societal context, where multiple forces – economic, environmental, political, educational, and psychological - come into play. It is not about simple ‘yes/no’ questions – it is our way to explore the complexity and possibly to find answers to ‘why’ questions for the most part. Let us start with some definitions.
Are we dealing with a system?
A system is an interconnected set of elements that is organized in a way that achieves a purpose. Three distinct entities of any system are elements, interconnections, and purpose (or function). These ensure system’s integrity and often determine such system’s properties and behaviors as development, resiliency, self-organization, self-repair, and eventually - sustainability. You can tell that you are dealing with a system, not a random collection of components, if you can identify the mutual impacts between the components and observe the outcome or behavior over time that is different from the outcomes or behavior of the separate components on their own.
For example, a forest is a system consisting of trees, soil, multiple species of flora and fauna – all of which are interconnected via food chains, nutrient flows, energy exchange, and many other chemical and physical processes. Its function is to provide environment and nutrition for sustaining living organisms and also to produce oxygen via photosynthesis. If one takes an element out of the system (e.g., taking a certain tree species and planting it in an isolated environment, or taking an animal and placing it in a zoo), those elements would behave differently, the same as the system deprived of a certain element will be affected and will react to the change.
In a social context, for example, a village is also a system, not a simple aggregation of houses and people. Houses may be connected through the utility networks, people are connected through trade, collaboration, and social relationships. Disruption of life and function on one side of the village would cause system’s reaction and change.
In the technical world, system functions can be even more obvious, since many engineering systems are designed by people for a specific purpose. Thus, a power plant system has a purpose to produce electric power and distribute it to a community or facility. It consists of equipment, workers, transportation means, fuel stocks, etc., all of which are interconnected in power production cycle.
How do you know that you are dealing with a system, not just a bunch of random things?
Answer these questions:
- Can you identify the connections (mutual influences) between parts?
- Do the parts working together produce a different result from that of each of the parts separately?
- Does the behavior persist over time or trend in a certain direction (not random)?
If the answer is 'yes' to one or more of these questions, chances are you are dealing with a system, and you can expect systemic response if you try to change it.
System elements
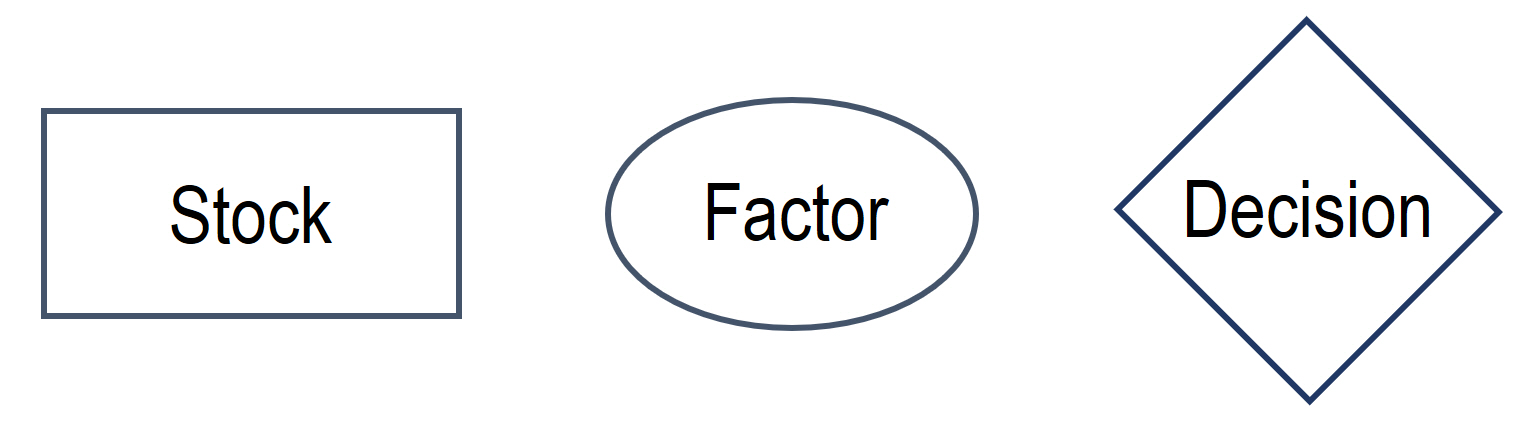
Next, we are going to cover three types of elements that will be used in system analysis further on. Specifically, those include: stocks, factors, and decision points.
Stocks
Stocks can be represented by sort of matter, commodity, or good. Stocks are cumulative and are characterized by measurable amount. They can accumulate (increase), deplete (decrease), or stay steady. In system diagrams, we are going to show each stocks as a box.
Examples of stocks:
- Money on the bank account
- Number of trees in the forest
- Number of people living in a town
- Amount of food stored for winter
- Amount of energy stored or generated at a power plant
Very often, the stability of a system depends on the maintenance of its stocks. If the bank account is stable or growing, we believe that whatever system maintains it is working well. If there is no decline in tree population, we assume the forest is healthy.
Factors
Factors can be represented by processes, flows, phenomena, actions, and even feelings that have influence within a system. Factors are measurable, but not necessarily cumulative, and are typically characterized by rates or intensity of process rather than countable amounts. Rates are important since they will affect the variations of stocks. In system diagrams, we are going to include factors in ovals.
Examples of factors:
- Rate of tree growth in the forest
- Air temperature at the forest location
- Electricity price at local market
- Solar irradiance at a specific location
- Number of cups of coffee you drink per day
Almost anything can be included as a factor in a system, as long as its variation influences the system state or other elements.
Decision Points
Decision points are very special elements that represent deliberate controls of the system by humans. Humans make a variety of decisions, which may or may not be dictated by the system behavior, and can be based on knowledge, personal choices, feelings, political views, conscience, etc.
Examples of decision points:
- Adopting a policy
- Decision to invest in growth of business (or not)
- Decision to restrict construction or practice
- Decision whether the stock level is dangerously low
In system diagrams, we are going to depict decision points as diamonds.
There may be other elements that are distinguished in various system models. But for the sake of simplicity, we are going to mainly operate with the three elements described above.
System Connections
In a system, elements are interconnected and may influence one another. If connections are not identified, the collection of elements you have, may not be a system after all. The following types of connections are most important.
Positive Coupling
Positive coupling is when an increase in A results in an increase in B.
- Increase in sunlight leads to higher solar panel output
- Increase in coal combustion results in growth of CO2 emissions
- More chickens, more eggs
This will also work backward: Fewer chickens, fewer eggs, etc.
This type of connection can be shown with a regular arrow:

Negative Coupling
Negative coupling is when an increase in A results in a decrease in B.
- Increase in mileage decreases car’s service life
- Amount of food consumed decreases the feel of hunger
- Increase in spending decreases amount of money in the bank account
And again, vice versa, in case of a negative coupling, a decrease in A would increase B. You can check if this opposite connectivity works with the above examples (it is not always the case).
This type of connection can be shown with a circular arrow:

It is important to understand that the connection drawn from A to B is not at all identical to the connection from B to A. We cannot simply put the arrow both ways automatically. For one of the example of positive coupling, we said: “increase in sunlight leads to higher solar panel output”. Obviously, the reversed relationship will not work: increase in solar panel output will NOT increase the amount of sunlight, and in fact it will not affect the amount of sunlight at all. So, before drawing the arrow from B to A, we need to think first if there is actually a reverse impact, and if yes, then whether it is a positive or negative coupling.
Feedback Loops
Feedbacks are very interesting properties of systems. Feedbacks are higher in the hierarchy of causal connections than couplings. While a coupling simply denotes the influence of one system element on another, feedbacks go further to show how those other elements impact the original cause. A feedback is always a loop, and therefore must contain at least two, but often more couplings in it. Here are some examples.
- More chickens, more eggs. But if we have eggs that can hatch and produce more chickens, we have a reverse connection: more eggs, more chickens. This is feedback.
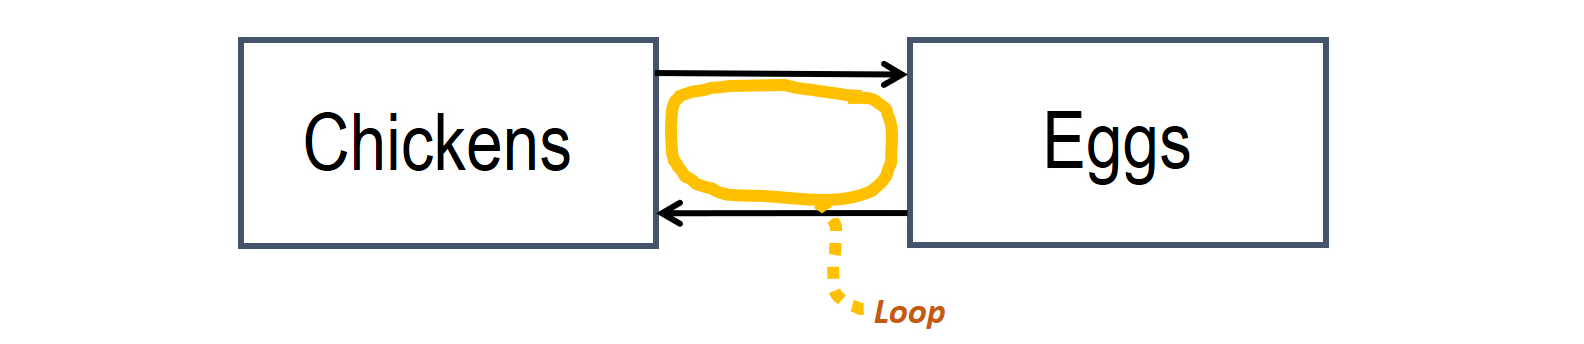
- More stuff bought, less money left. That is a negative coupling. However, the less money is available, the less stuff we can further buy. This is a positive connection on the way back. And again, using these two couplings, we can identify a feedback loop between these two elements.

We can see from these two simple examples that feedback always “backfires” to the original element and affects any other element in the loop via circular impact.
Feedbacks are interesting internal mechanisms that can either stabilize or destabilize the system. In the next section of this lesson, we will consider two main feedback types – positive and negative – and see what effects they can cause.
Self-Check Questions
(There are three questions. Click on dots at the bottom to switch between questions. Click "check" at the bottom left of each question to check the answer)