5.1.1 Validity
Data are not created equal; data vary in their quality. Data quality is a concept with multiple components that include ideas of data precision and accuracy, thus a focus on whether the data are specific enough and how much error they contain. Data quality also includes data relevance, which determines whether or not the data are suitable for a particular application. Aspects of data quality are often characterized overall as “fitness for use.” The degree to which data are fit for an application can be affected by a number of characteristics, ranging from discrepancies and inconsistencies in the formatting of the data to the data being of the wrong type or having too many errors.
Imagine you’re one of the interested rangers tracking grizzly bears through a wildlife refuge in an attempt to identify areas where the public might come into contact with the animals. Radio collars worn by the bears are sending new locational data every five minutes, and with each update, the bears’ activity patterns become evident. In this instance, there are no problems with data validity: you are interested in the bears’ positions, and that is exactly the data your tracking equipment is receiving.
Since these fictional, error-free tracking data are perfectly relevant for the problem at hand, there is no need to consider alternative data. The data quality is clearly high enough for the purpose at hand.
Data with quality this high in relation to the purpose is not the norm, nor is it always needed. Often, we must make very careful decisions about which data to use and why one set of data may be better than another. Rather than knowing the precise location of every bear in the refuge, a much more likely scenario would involve rangers relying on one or more of the other databases they may have; their available databases might include: trapping records, reported bear sightings by guests, veterinary logs, and sales from the visitor center.
Although the sales records from the visitor center could be disregarded as not suitable for the purpose at hand, the other data are all potentially relevant. In this case, the rangers would have to decide which database, or combination of databases, would be the best fit for the task of identifying park locations where restrictions on public access might be needed to prevent close encounters with bears.
This scenario illustrates that data quality can depend not just on the data but also on the intended application. Data that may not be suitable and valid for one purpose may be very suitable for another. Locational data that are only certain to the nearest kilometer might be of high enough quality for rangers to determine the number of bears in the refuge. A missile defense system with location sensors having a similar potential for error would probably not be considered of sufficient quality to use.
5.1.2 Precision and Accuracy
Positions are the products of measurements. All measurements contain some degree of error. With geographical data, errors are introduced in the original act of measuring locations on the Earth's surface. Errors are also introduced when second- and third-generation data are produced, for example, when scanning a paper map to convert it to a digital version or when aggregating features in the process of map generalization.
In general, there are three sources of error in measurement: human beings, the environment in which they work, and the measurement instruments they use.
Human errors include mistakes, such as reading an instrument incorrectly, and faulty judgments. Judgment becomes a factor when the phenomenon that is being measured is not directly collected (like a water sample would be), or has ambiguous boundaries (like the home range of a grizzly bear).
Environmental characteristics, such as variations in temperature, gravity, and magnetic declination over time, also result in measurement errors.
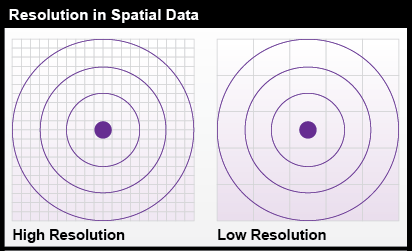
Instrument errors follow from the fact that space is continuous. There is no limit to how precisely a position can be specified. Measurements, however, can be only as precise as the instrument’s capabilities. No matter what instrument, there is always a limit to how small a difference is detectable. That limit is called resolution.
The diagram in Figure 5.1 shows the same position (the point in the center of the bullseye) measured by two instruments. The two grid patterns represent the smallest objects that can be detected by the instruments. The pattern on the left represents a higher-resolution instrument.
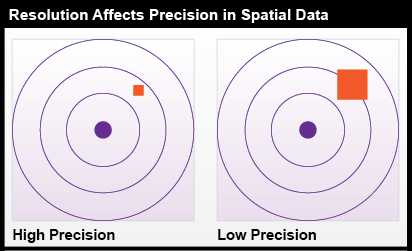
The resolution of an instrument affects the precision, or degree of exactness, of measurements taken with it. Consider a temperature reading from a water sample. An instrument capable of recording a measurement of 17 °C is not as precise as one that can record 17.032 °C. Precision is also important in spatial data, as can be seen in in Figure 5.2. The measurement on the left was taken with a higher-resolution instrument and is more precise than the measurement at the right.
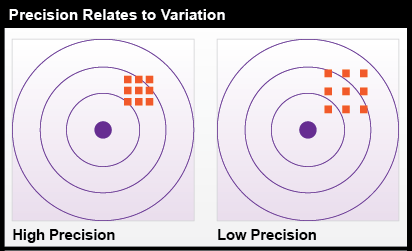
Precision takes on a slightly different meaning when it is used to refer to a number of repeated measurements. In Figure 5.3, there is less variance among the nine measurements at left than there is among the nine measurements at the right. The set of measurements at the left is said to be more precise.
Precision is often confused with accuracy, but the two terms mean very different things. While precision is related to resolution and variation, accuracy refers only to how close the measurement is to the true value, and the two characteristics are not dependent on one another (Figure 5.4).
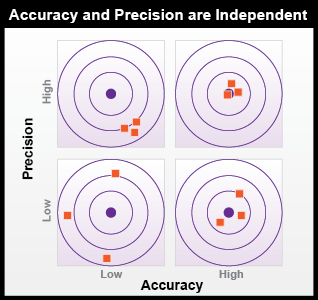
- High Precision and Low Accuracy: three dots are condensed Southeast from the center dot on the second ring out from center.
- Low Precision and Low Accuracy: three dots are spaced (one north, one south, one west) all on or beyond the second ring out from center.
- High Precision and High Accuracy: three dots are closely spaced over the center dot.
- Low Precision and High Accuracy: three dots are more loosely spaced and lay around the center dot, on or within in the first ring out from center.
When errors affecting precision or accuracy occur, they can be either systemic errors or random errors.
Systemic errors generally follow a trend and demonstrate consistency in magnitude, direction, or some other characteristics. Since systemic errors follow a trend, they can often be corrected by adjusting the measurements by a constant factor. For instance, if temperature readings consistently come out 17 °C too high, subtracting 17 °C from the measured values would bring the readings back to accurate levels. This type of correction is called additive correction. Sometimes more complex adjustments are needed, and values may have to be scaled by an equation that has been determined after investigating the trend in errors. This is referred to as proportional correction.
Random errors do not follow an organized trend and can vary in both magnitude and direction. Without predictable consistency, random errors are more difficult to identify and correct. In the presence of random locational errors, accuracy can often be improved by taking the average of the data points from multiple measurements for the same feature. The resultant data value is likely to be more accurate than any of the individual base measurements.
Prior to 2000, GPS signals were intentionally degraded for civilian use for national security reasons. The process used is called Selective Availability (SA), which deliberately introduced error to degrade the performance of consumer-level GPS measurements. The decision to turn SA off in 2000 made GPS immediately viable for civilian use, and we have seen a dramatic increase in GPS-enabled consumer technology since that point. For more information on Selective Availability, visit GPS.gov.
Practice Quiz
Registered Penn State students should return now take the self-assessment quiz about the Geospatial Data Quality.
You may take practice quizzes as many times as you wish. They are not scored and do not affect your grade in any way.