Stereoplotters and Photogrammetric Workstations
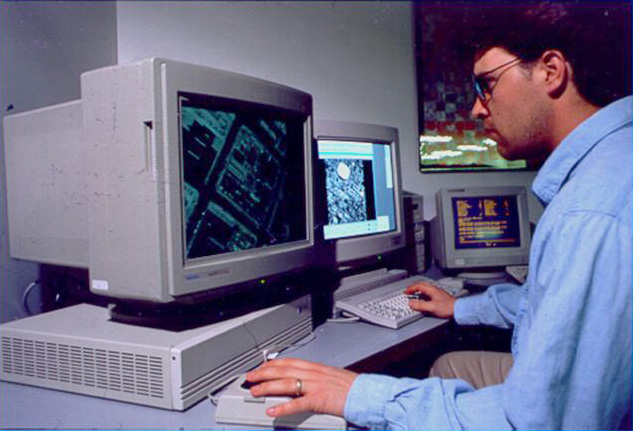
A stereoplotter is an instrument that can be used to recreate stereo models, so that a 3-dimensional model of the ground can be viewed, measured, and mapped by an operator. Compare the historical stereoplotters in the Lesson 1 reading to the softcopy workstation shown below. Binoculars have been replaced with other, less restrictive, forms of 3-dimensional viewing. In the example below, the glasses worn by the operator are polarized so that his right eye is seeing one image of the stereo pair, and his left eye is seeing the other.
Feature and Elevation Collection
Prior to the advent of digital workstations, map features were scribed by photogrammetric technicians on a drawing table integrated into the stereoplotter apparatus, often employing a pantograph to enlarge the drawing to the final, desired map scale. Skilled cartographers would then use colored inks on semi-transparent materials, such as mylar, to create master map sheets that could be reproduced by blueprint or photo offset processes. These cartographers would add labeling and annotation as required. The final map was as much a work of art as it was a feat of technology. Today, feature data can be easily captured as 2-dimensional or 3-dimensional points, lines, and polygons when a Computer Aided Design (CAD) or GIS system is integrated into the softcopy workstation. Points might describe the location of fire hydrants, light poles, or simple building locations; lines could represent road or stream edges and centerlines; polygons are often used to represent detailed building footprints, stands of vegetation, water bodies, etc. In either a CAD or GIS package, each feature can be collected with unique line styles, line weights, and colors. If GIS software is used, the operator can also collect attribute information, such as road surface material, or building type, insofar as he can interpret this information from the aerial photograph.
Elevation data can be captured in a variety of ways; as in the case of feature data, methods have evolved along with photogrammetric technology. The earliest method for collecting elevation data was to manually draw isolines of elevation, or contours. It requires a great amount of skill and experience for an operator to draw spatially accurate, aesthetically pleasing contours. Contours are still one of the most effective representations of 3-dimensional topography on a 2-dimensional map; they are laborious to draw by hand, and while they can be generated automatically in a number of software packages, it usually requires a lot of manual editing to smooth jagged lines, to remove small artifacts, and to add labels. Many engineers learned to use contours early in their careers and still prefer them to other more modern, automated forms of digital elevation data.
Profiling is a technique of elevation data capture that was used extensively by the USGS and many private firms to create elevation data intended for input into the orthorectification of imagery. In this method, the stereoplotter is set to automatically drive the digitizing mark in evenly spaced profiles running the length or width of the stereo model. The operator's job is to keep reading elevations as accurately as possible in this dynamic environment; the stereo plotter automatically records elevations at regular intervals. The end result is a grid of regularly spaced points, which may or may not correspond to interesting or significant features of the actual terrain. This method of profiling works best in flat areas and in applications where accuracy and detail are not required. It was used quite a bit in the early days of orthophoto production, but is less common today.
Most elevation data derived from photogrammetry today is captured as randomly spaced mass points and breaklines. The photogrammetric technician collects individual 3-dimensional points at whatever frequency and in whatever pattern he deems appropriate to represent the ground surface. In addition, important linear features, such as road edges, curbs, walls, ridges, drains, etc., are captured as 3-dimensional lines. The mass points and breaklines are combined using surface modeling software to create a triangulated irregular network, or TIN. These elevation data products will be explained in more detail in the next lesson.