Undersaturated black oils, sometimes referred to as “low shrinkage oils,” are single-phase liquid systems that reside in reservoirs with an original temperature that is significantly lower than critical temperature, TC. The phase diagram for an undersaturated black oil is shown in Figure 2.12.
In this figure, the reservoir temperature, TR, and reservoir pressure, pR, at the time of discovery are determined by the earth’s local temperature gradient and hydrostatic pressure gradient, respectively. The phase diagram for the crude oil is determined by the composition of the crude oil. As shown in this figure, the original reservoir temperature and pressure lie in the single-phase liquid region of the phase diagram at a temperature lower than the critical temperature.
The term “undersaturated” implies that the crude oil has the capacity to dissolve additional gaseous components and remain in the single-phase region. For example, if we change the composition of the system by adding more lower molecular weight components (e.g., methane and ethane), then the phase envelope would expand with the bubble-point locus beginning to shift towards the Point (TR, pR). In this example, we could continue to add gaseous components to the system until the bubble-point locus has shifted all of the way to the Point (TR, pR). At this point, with Point (TR, pR) lying on the bubble-point locus, we would call the fluid a bubble-point fluid. This is the point where the system would be unable to accept additional gaseous components and still remain a single-phase liquid, i.e., a single-phase crude oil. We will discuss the significance of the term “low shrinkage” when we discuss “high shrinkage” volatile oils.
The production of oil and gas is an isothermal process. We typically deplete the reservoir pressure by removing fluids from the system. Even in the cases where we inject fluids at different temperatures into the reservoir, such as with steam injection, the volume of fluids that we inject are so small compared to the size of the reservoir and the over- and under-burdens that, at most, we cause a local change in the temperature at the point of injection and have no significant impact on the temperature of the system. For isothermal processes, the pressure-temperature path of the fluids inside the reservoir is a vertical line at a fixed temperature. This is represented in Figure 2.12 (A) as the solid black arrow going from Point (TR, pR) to Point (TR, pA).
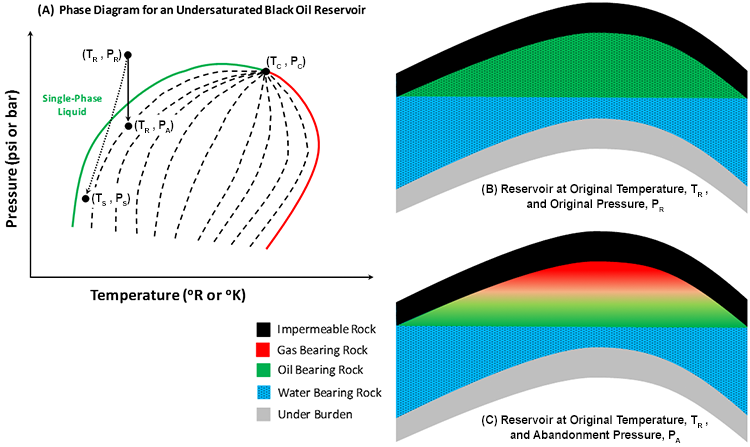
Figure 2.12 (B) shows the undersaturated black oil in an anticlinal trap at the time of discovery, that is, at the original reservoir temperature, TR, and pressure, pR. This figure depicts a single-phase liquid hydrocarbon (crude oil) system. As we produce reservoir fluids, single-phase oil (and the dissolved natural gas components) and possibly water, the pressure in the reservoir depletes. This is the solid arrow from Point (TR, pR) to Point (TR, pA). At some point in time, the reservoir pressure drops below the bubble-point pressure, and we enter the two-phase region in the phase diagram. At this point in time, a second, free gas phase evolves in the reservoir. This occurs when the path of the reservoir fluids crosses the green, bubble-point locus.
As we continue production, we now produce crude oil (and the gas dissolved in it), free natural gas, and, possibly, water. At some point during the depletion process, the natural pressure in the reservoir becomes so low that it can no longer overcome the weight of the fluids in the wells and lift these fluids to the surface at commercial rates. At that point in time, we may be able to install some form of artificial lift (e.g., pumps) to help the natural reservoir pressure lift the reservoir fluids, but that is only a temporary solution, and eventually we will be forced to abandon the reservoir. The pressure at which we abandon the reservoir is called the “abandonment pressure,” pA.
Figure 2.12 (C) shows the same reservoir at abandonment conditions after the free gas phase has developed. Since gas is lighter than oil, it will migrate to the top of the reservoir and accumulate there. When gas comes out of solution due to pressure depletion and accumulates at the top of a reservoir, we refer to the resulting accumulation as a “secondary gas cap.”
Please note that we may run into some situations in which the abandonment pressure occurs before we drop below the bubble-point pressure. In these cases, the path of the reservoir fluids would remain in the single-phase liquid region, and a free gas phase would never develop in the reservoir.
Also depicted in Figure 2.12 (A) is the dashed arrow from Point (TR, pR) to Point (TS, pS). This is the path that the reservoir fluids travel in the well and through the surface facilities. Point (TS, pS) refers to the separator conditions. The separators are field equipment, typically designed by facilities engineers, that are used to separate the produced fluids. Normally, produced oil has a higher commercial value to the oil and gas company than produced natural gas, so typically the facilities engineers design the separators to optimize the volume of liquid at the surface. In other words, the faculties engineers will design the separator conditions TS and pS to lie on the quality line of the phase diagram with the maximum feasible volume percent liquid.